ATR is the abbreviation of Average, True, Range, and is translated into Chinese as Average True Range. It, along with RSI (Relative Strength Index) and SAR (Parabolic Index), were all invented by American technical analyst Welles Wilder. This article will introduce the purpose of the ATR indicator, actual trading application examples, advantages and disadvantages.
1. Introduction to ATR indicator
Similar to RSI and SAR indicators, ATR is only a technical indicator used to measure the volatility of the market. It is based on the quantitative data of recent price fluctuations, so it cannot determine the direction of the trend. On the contrary, the dominant logic behind RSI and SAR can be used to determine long and short positions to some extent. The original intention of ATR is to allow users to use a simple calculation method to measure the volatility of commodities and help traders make decisions.
However, Wilder found that it was too simplistic to only focus on the day's volatility (the day's opening and closing prices). Without historical data for comparison, it would not be able to fully reflect market changes.
Therefore, in order to show the true volatility of the market, he considered calculating the difference between the previous day's closing price and the day's rise and fall, and then adding an average parameter to TR to make the indicator more representative and form a series of numbers.
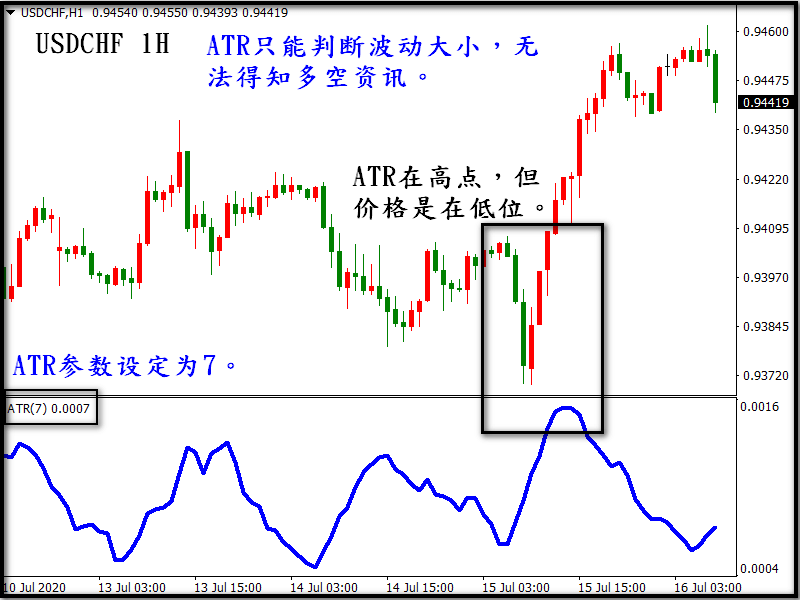
*As can be seen from the above figure, ATR cannot determine the rise and fall of the trend, but can only determine the size of the fluctuation.
2. Detailed explanation and diagram of ATR
Average: refers to the time of the previous few days (parameter setting).
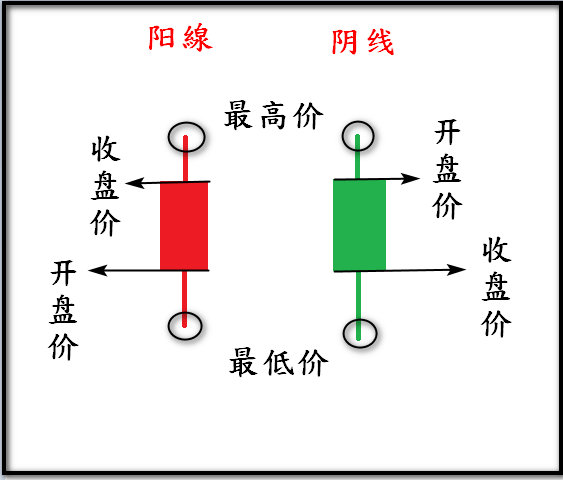
Reality: The K-line must include the gap part and cannot be omitted.
Range: The amplitude of the previous and next K-lines added together.
TR: True Range.
- Calculation formula: (TR of <parameter-1> + current TR)/parameter = ATR
- Example: Parameter setting 7, (TR of the previous 6 days + TR of the current day)/7 = 7-day ATR value
How to calculate TR
The calculation of TR is very simple, and there are two algorithms in total.
The first TR: normal K line
Highest price – Lowest price = TR
The second TR: gap
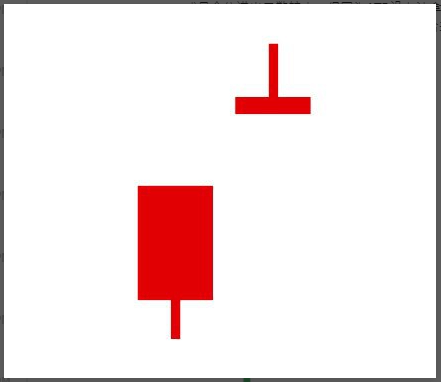
Gap high opening: the opening price of the right K-line is higher than the closing price of the left K-line.
Take the highest point on the right – the closing price on the left = TR
It is also today's highest price minus yesterday's closing price (take the absolute value)
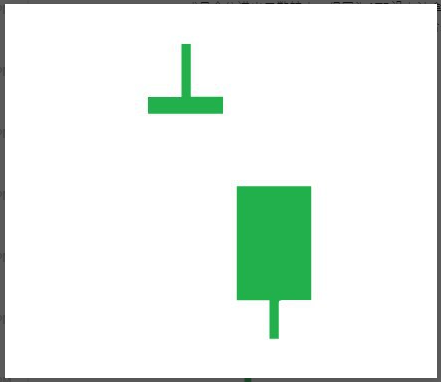
Gap open: the opening price of the right K-line is lower than the closing price of the left K-line.
Take the closing price on the left – the lowest point on the right = TR
It is also today's lowest price minus yesterday's closing price (take the absolute value)
3. ATR indicator function
The greatest use of ATR is that it can help traders predict the future price fluctuations and estimate the entry point before establishing a position, or how to set the exit point after establishing a position.
Generally speaking, the greater the fluctuation, the greater the ATR value, which means that the commodity is currently facing a wave of rising or a large retracement, which also means that the commodity trend is currently affected by more or more important external factors, and also reflects the brisk trading of the commodity. On the contrary, if the fluctuation is smaller, the ATR value is smaller, which means that the commodity is currently in a horizontal consolidation or unilateral slow movement, which also means that the commodity is currently in a long-short struggle and the trading is quiet. In short, the ATR value indirectly reflects the activity of market transactions.
Therefore, traders can use the fluctuation trend and size of ATR as the basis for taking profit and stop loss, so as to try to grasp the profit space and avoid stopping loss of positions during market fluctuations.
Of course, ATR cannot determine the trend direction, so investors need to use other technical indicators or K-line combinations to interpret the entire market trend.
4. Examples of the application of ATR indicator in trading
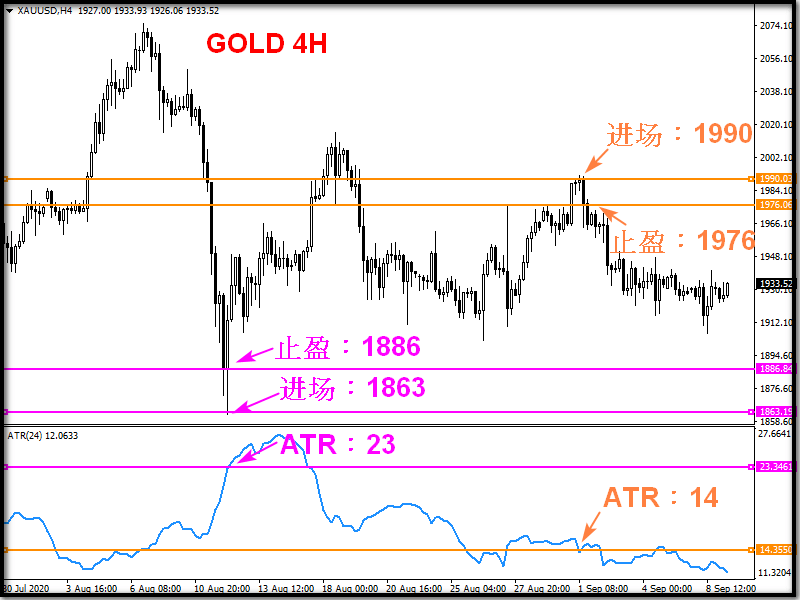
The above picture is a 4-hour chart of gold (purple lines represent long positions, and orange lines represent short positions)
Use 1 times ATR to stop loss and take profit:
Long order: If an investor establishes a long position at 1863, both stop loss and take profit can be set using ATR. At that time, the ATR value was 23, so the take profit point can be set to 1886 (1863+23) and the stop loss point can be set to 1840 (1863-23).
Short order: Similarly, if you enter the market at 1990, the ATR value is 14 at that time, the take profit will be 1976 (1990-14) and the stop loss will be 2004 (1990+14).
The above figure uses ATR as 1 as the setting, but if you think the current ATR value is too small and the expected ATR may become larger, you can adjust the required multiple budget yourself
For example, if there is important data that night, the commodity volatility is expected to increase, but the ATR value is small due to the current quiet trading. At this time, the stop loss and take profit targets of the entry position can be set to more than 1 times the current ATR.
If you feel that the market is certain after placing an order, you can also set the stop loss of ATR to 1 times and the take profit to more than 1 times. However, it is not recommended to set the stop loss multiple greater than the take profit multiple, because in the long run, it will cause an unequal profit and loss ratio.
5. How to set ATR on MT5 platform
After opening the MT5 software
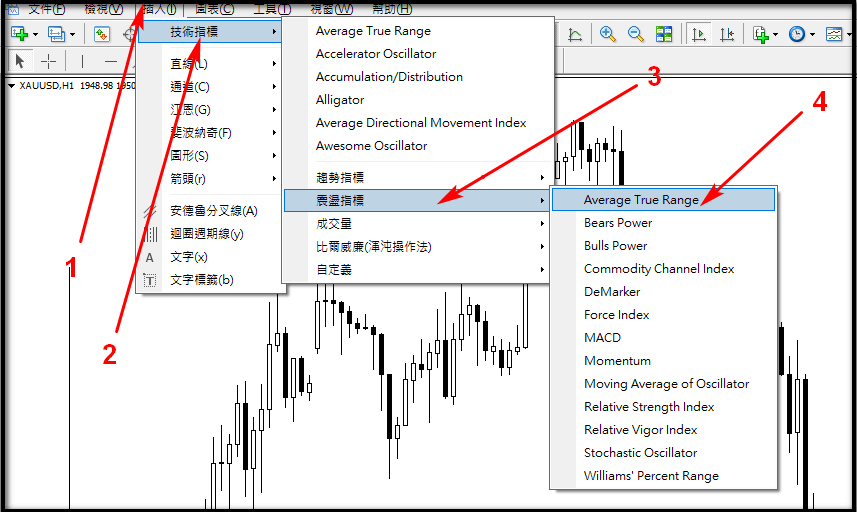
1. Click Insert
2. Select technical indicators
3. Enter the oscillator
4. Click ATR
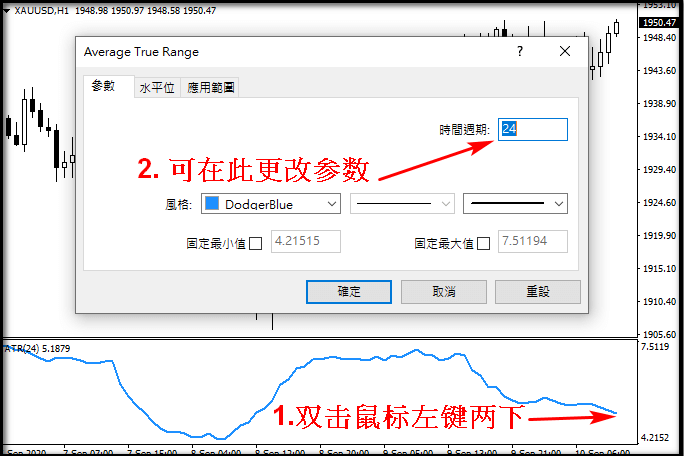
Recommended parameters: 15-minute chart → 16 (~4 hours), 1-hour chart → 24 (~1 day), 4-hour chart and daily chart → 6 or 5 (~1 day and one week).
6. Advantages, Disadvantages and Precautions of ATR
ATR Advantages
- Because each commodity has different characteristics, the fluctuation range is also different. The ATR calculation method can be applied to each commodity.
- ATR can be used as a standard for both stop loss and take profit, and its usage is relatively objective. It should be noted that when ATR fluctuates greatly, it means that the current market is volatile. You can use 1 times or even more of ATR to set stop loss to avoid being swept out when the market fluctuates. The same applies to take profit.
ATR Disadvantages
- Method to judge the direction of the trend.
- There is no signal when switching between long and short positions. If used alone, it can easily cause illusions and lead to losses.