SAR is a technical indicator with English abbreviations. Its full name is Parabolic Stop and Reverse, which means "stop and reverse". Its purpose is to provide signals of market trend reversal, including stop-profit and stop-loss signals. When there is a fast trend (whether up or down), the SAR pointer analyzes the price and time, and this pointer will form a parabola, so the SAR indicator is also called the "parabolic indicator".
As a trader, the most difficult issue is how to "stop profit at the maximum value and stop loss at the minimum value". If you don't have a set of standard rules in your mind, you will definitely be at a loss. At this time, SAR is your best helper. When the market rises and falls, it simply and clearly tells you the timing and price of long and short conversion.
This article introduces the principle of SAR pointer and its application in trading. Finally, it will analyze the advantages and disadvantages of SAR.
The principle of the Parabolic SAR indicator
SAR assumes the price trend to be a parabolic movement and gives it a momentum trend indicator to make it closer to the current price. If the price crosses the pointer and a signal appears, it is used as a criterion to formulate strategies and establish positions.
When SAR is applied, it is consistent with the concept of trailing stop loss. When the price trend continues, the stop loss point is continuously moved up or down to lock in the profit of the position.
SAR calculation formula
The calculation of SAR requires reference to the highest and lowest prices of each day:
SAR (today): SAR (yesterday) + AF (momentum trend indicator) x [ (range extreme value (the most extreme value within the band) - SAR (yesterday)]
There are two nouns that need to be introduced here:
AF (Momentum Trend Indicator)
AF is a calculated acceleration factor. The value of the acceleration factor x (the difference between the range extreme value and yesterday's SAR) can be closer to the current price. The starting value of AF is 0.02. In an uptrend, as long as today's highest price is higher than yesterday's highest price, AF can be +0.02; similarly, in a downtrend, as long as today's lowest price is lower than yesterday's lowest price, +0.02 is also required; but as long as today's high price is not higher than yesterday or today's low price is not lower than yesterday, AF will not increase. However, the maximum value of AF is capped at 0.2. No matter the price is higher or lower than yesterday, the AF value is 0.2. Based on the above, we can know that the value of AF will only increase or remain unchanged, and it is impossible to decrease or even fall to 0.
Interval extremes
The range extreme value refers to the highest price between the bands in the rising band (when SAR is below the K-line) and the lowest price in the falling band (when SAR is above the K-line). The range extreme value of each day is absolutely the lowest or highest point in the current band, and the SAR on the reversal day is directly calculated by substituting the range extreme value of the previous day.
Here are two tables as examples:
| date |
9/1 |
9/2 |
9/3 |
9/4 |
| Assuming the highest price point |
2010 |
2009 |
2020 |
2017 |
Rising band extremes: 9/1: 2010, 9/2: 2010, 9/3: 2020, 9/4: 2020
| date |
9/1 |
9/2 |
9/3 |
9/4 |
| Assuming the lowest price point |
2010 |
2009 |
2020 |
2017 |
Downward band extremes: 9/1: 2010, 9/2: 2009, 9/3: 2009, 9/4: 2009
SAR 指标在黃金 (XAU/USD) 的应用例子
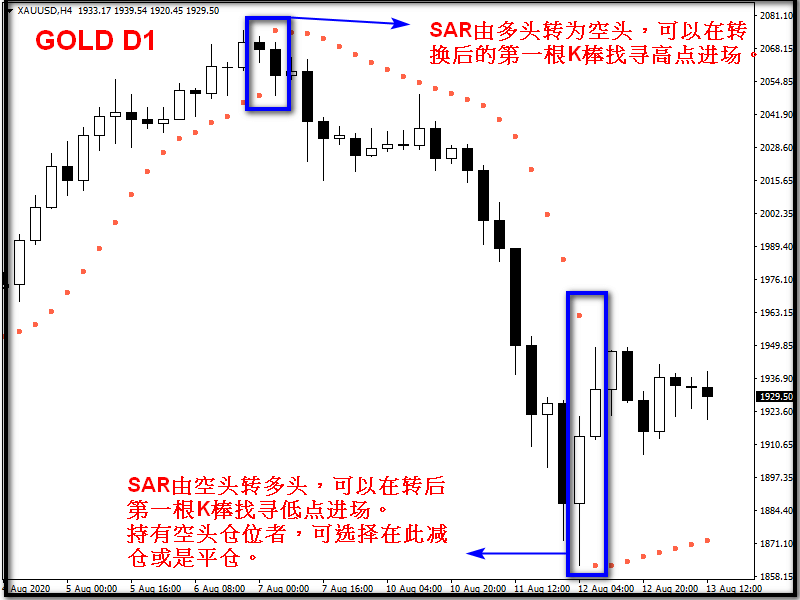
When the SAR band trend is in a bearish pattern, the SAR will decline synchronously with the price over time. However, if the price rises on the same day and touches the SAR, it will reverse to below the price and turn into a bullish SAR. Those holding short positions can choose to reduce their positions or take profits after this K-line appears, while the opposite is true for long positions.
Let me briefly explain the formation of the SAR curve: when the price is in an upward (downward) trend, the SAR at the lower (upper) edge will also rise (fall), but the speed of the SAR rise (fall) depends on whether the latest K-line has created a new high (low) point in the band, and this rising (falling) speed will eventually move in a "decreasing" manner, that is, connecting each parabolic point will form a curve, until the final upward (falling) kinetic energy is lost, the price will fall (rise) below the current SAR value, and the parabola formed by this point is the same as the principle of the final fall of the shell.
Advantages and disadvantages of SAR indicator
The use of SAR is similar to the moving average crossing and breaking trading method, except that SAR directly gives a clear point, and when the price touches it, it will reverse directly, and reserve space for the next long-short conversion. However, this is also the contradiction of SAR. It gives traders space when encountering a reversal, but when entering the market, if the market fluctuates too much, the probability of touching SAR in a short period of time is not high, but once it is touched, it will be a considerable loss.
When the SAR pointer reverses, it is usually at the relative high and low points in the price trend. However, after entering the market, traders must not forget that the AF after the current reversal is the minimum value (that is, it starts from 0.02). Therefore, if there is no trend or one higher (lower) than the other within a period of time, the entry position may get closer and closer to the SAR point, eventually triggering the stop loss.
Advantages of SAR indicator
1. Long and short judgment is very simple, and the conversion point is very obvious
2. When the trend is clear, indicators can help traders grasp the market trend within the band
3. Stop loss and take profit are very practical.
Disadvantages of SAR indicator
1. The entry point needs to be found by yourself, which is the most difficult point in this indicator
2. When the volatility is too large, the SAR will continue to change, and the probability of triggering stop loss is high and the loss is large
3. When volatility is too large, the arbitrage exit point is often far from the optimal point
4. There is a lack of standards for the length of the cycle.