
The VIX index, full name The CBOE Volatility Index, was created by the Chicago Board Options Exchange in 1993. It is based on the option price of the S&P100* , one of the three major stock indexes in the United States at the time , and is calculated by weighted average after calculating the implied volatility. Since the VIX index can measure market sentiment and estimated risks, it is also called the "fear index."
This article will explain the relationship between the VIX index and the performance of the U.S. stock market, as well as its usefulness to investors.
*S&P100 was renamed S&P500 in 2003 , which stands for Standard & Poor's 500 Index
The VIX index is calculated based on the S&P 500 index, according to the option prices * of this week and the S&P 500 index , and the level of its implied volatility, that is, the call and put option prices of the S&P 500 near-month and next-month, and is used to predict market volatility in the next 30 days.
* An option is a fixed-term contract in which the buyer has the right to buy or sell the underlying asset at a predetermined price at a future agreed time. Therefore, the rise and fall of the option price shows how much the investor is willing to pay in the future to hedge the risk of the bid, and the market can analyze the market situation through these data.
The following is the VIX index formula:
Because its calculation method is very complicated, we will not discuss it here. Instead, it is relatively important to understand the reasons why the VIX index and the S&P 500 index perform in opposite directions.
The VIX index can represent the views of most investors on future market trends and predict changes in market trends. Therefore, when the VIX index value becomes larger, it means that the market will become more volatile in the future and there may be uncertainties in the stock market; when the VIX index value becomes smaller, it means that the market will be stable in the future and the stock market may not experience large fluctuations.
There are several key values on the VIX index that investors need to pay attention to:
In extreme market conditions, the VIX index may also show some high or low values, such as panic selling during a stock market crash, or investors blindly entering the market to chase the rise in a bull market. In these two extreme market sentiments and one-sided market conditions, special attention should be paid to the two values of 15 and 40 :
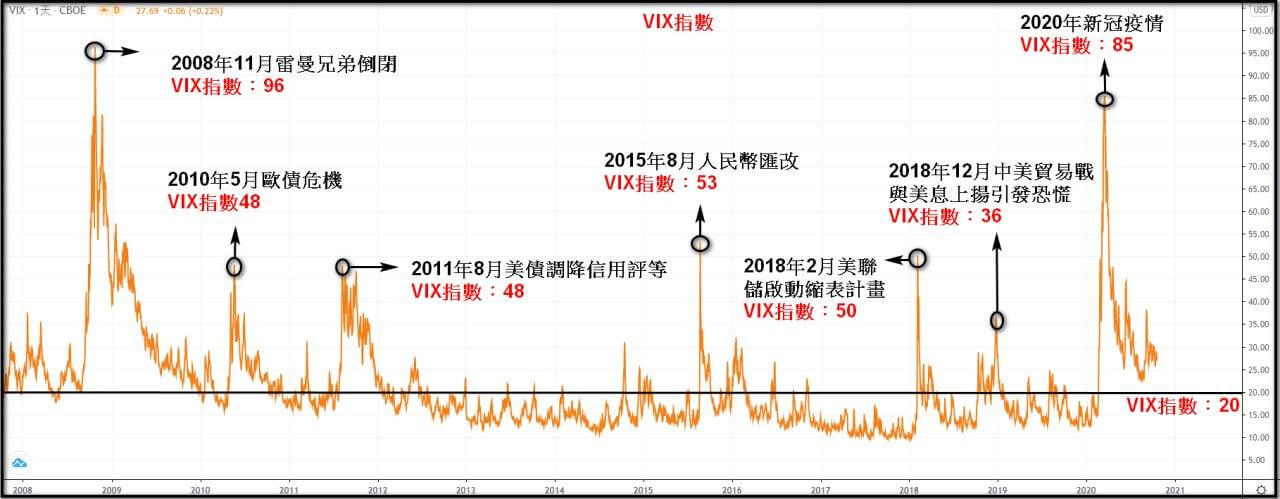
Figure 1: Major events over the years and VIX index performance
When the VIX index is higher, it means that investors are uneasy about the future trend of the S&P500 ; on the contrary, if the index is lower, it means that investors are stable about the future trend of the S&P500 . Therefore, the VIX index tends to rise in a bear market environment; in a bull market environment, the VIX index tends to fall or remain stable. This is because the VIX index is calculated based on implied volatility, and the long-term bullish S&P500 has a lower implied volatility.
It can also be understood that when the S&P 500 index falls, investors' demand for options will be strong. In order to protect their positions, bullish investors buy put options for their investment portfolios, causing the implied volatility and VIX index to rise . Conversely , when the S&P 500 index rises, the demand for options will be sluggish, and the implied volatility and VIX index will also decline accordingly.
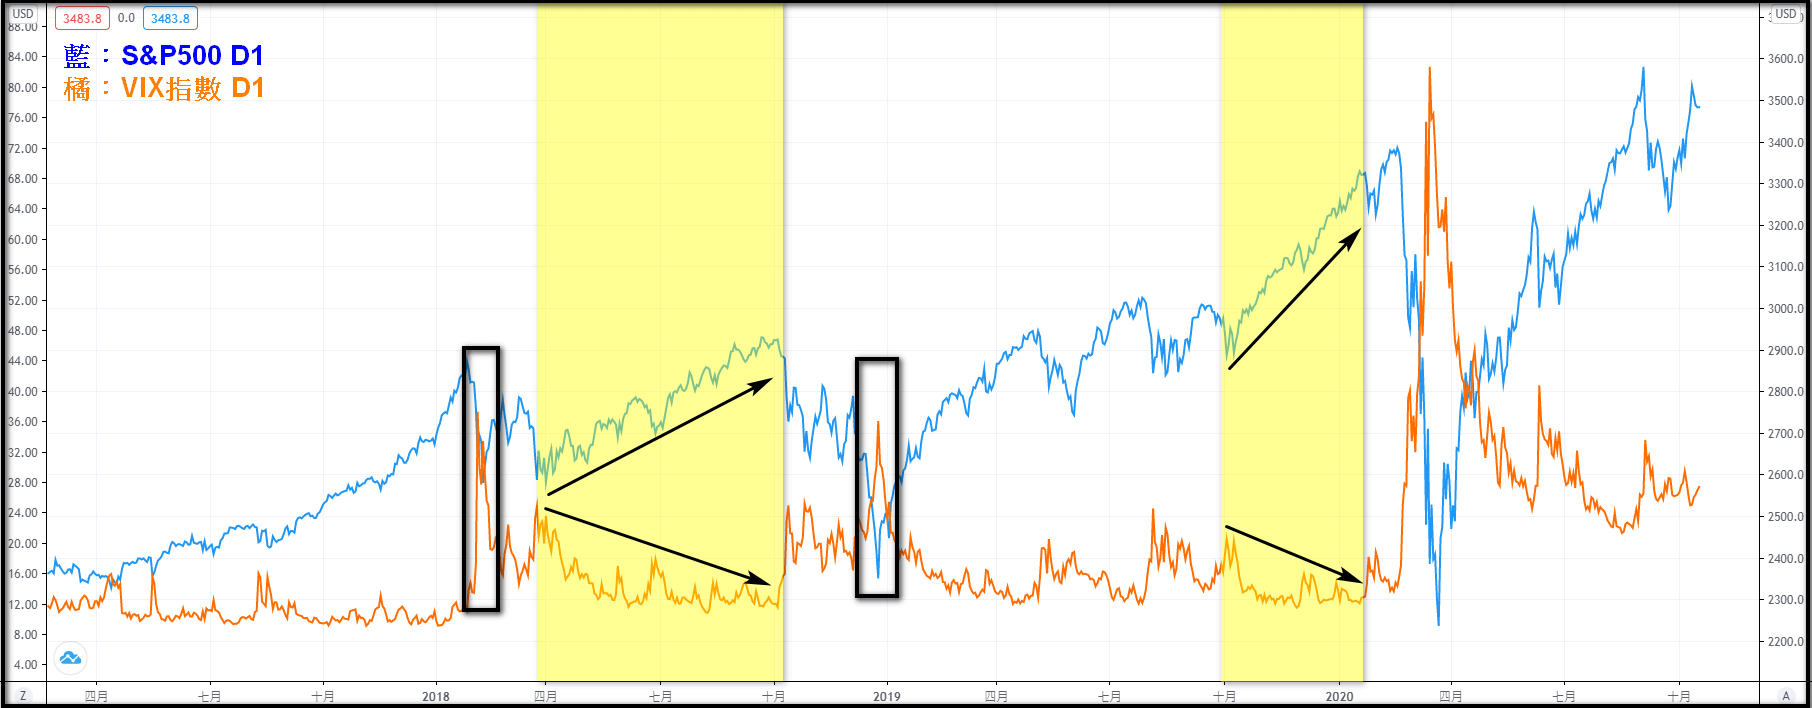
Figure 2: Correlation between the S&P 500 and the VIX
From the figure, we can see that the S&P500 index and the VIX index are moving in opposite directions , and there is a strong negative correlation between the two. According to statistics over the years, the average negative correlation between the two is -80% , ranging from -70% to -90% . This means that when the stock market falls, the VIX index will rise, and when the stock market rises, the VIX index will fall.
The VIX index can predict future market trends due to its leading nature, which is contrary to the calculation of past prices by "actual volatility". The VIX index is based on the amount that investors are willing to pay after buying or selling stocks ( using options as a tool when expecting a sharp rise or fall in stock prices ) to hedge their positions and avoid risks. Therefore , the VIX index is an emotional reflection for investors and can also be used as a leading indicator to judge the future market. Of course, the VIX index cannot accurately predict the trend, but it can reflect the market atmosphere at the moment, so investors can make appropriate risk management, such as reducing positions or even closing positions.
Generally, when the market plummets, investors will quickly buy put options to hedge risks, pushing up the VIX index, which often causes the index to peak in a short period of time. This may also be a leading signal to determine whether investors are overly pessimistic about the stock market at the moment and overreact. Generally speaking, most indices cannot stay at high levels for a long time, which means that the market may eventually rebound, which means that investors can refer to the rise and fall of the index to find the bottom to enter the market when the market is in panic.
At present, the VIX index, from an indicator of market volatility, has become a tradable target (2004 ) . During this period, more derivatives related to the VIX index have appeared, allowing investors to trade the VIX index. Because of this, the VIX index has become more volatile because it can be traded, and it will also make predictions in the stock market less accurate ( for example, directly entering the market to be bullish on the VIX index instead of purchasing options ), but it still has a certain reference value for the general direction of expectations.
All financial products traded on margin carry a high degree of risk to your capital. They are not suited to all investors and you can lose more than your initial deposit. Please ensure that you fully understand the risks involved, and seek independent advice if necessary.