In the trading market, MACD is one of the most widely used technical indicators. What is the use of MACD indicator? This article will explain in detail the use of MACD, as well as the interpretation of divergence, golden cross, death cross and other phenomena.
1. What is the MACD indicator?
MACD is the abbreviation of Moving Average Convergence Divergence in English. Its Chinese name is "Smoothed Moving Average Convergence Divergence". It was invented by American Gerald Appel in 1970. It is a technical analysis tool with a long history and is still used today. Its principle is to provide entry signals based on the interlaced trend of two "fast" and "slow" lines and the length of the column.
2. Basic usage of MACD indicator
MACD uses the 0 axis as the long and short benchmark, and is composed of two curves and a series of bars. One curve is called the DIF line and the other is called the MACD line.
Before introducing the MACD indicator, we must first understand what "Exponential Moving Average" (EMA) is. The price of each day is important, so investors will average the prices of each day to form a simple moving average (SMA). However, it often happens that on a day far away from the present, the accuracy of the moving average is disturbed due to excessive fluctuations. The original intention of EMA calculation is to avoid such situations. The more recent the price, the greater the weight, making the moving average more sensitive to recent price trends. On the contrary, the more distant the price, the smaller the weight. From the above, we can see that the calculation method of EMA is to calculate the moving average with different daily weights.
The composition of the MACD indicator is as follows:
1. DIF line
It is formed by subtracting two EMAs (closing price values) formed by long and short parameters. Generally, the short term in the daily chart is set to 12 days and the long term is set to 26 days. The difference is the "difference value DIF", which also represents the situation where the short-term EMA deviates from the long-term EMA, and it is called the "fast line".

2. MACD line (signal line)
Take the DIF value and make another EMA, which is usually set to 9 days. Since it has been smoothed again, this line is more sensitive to prices than the DIF line, so it is also called the "slow line", also called DEM.

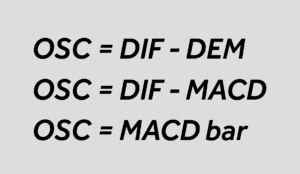
3. Oscillator (OSC or MACD bar)
In order to concretize the trend of the two lines, the DIF line is subtracted from the MACD line, and the difference is the length of the bar within the indicator.
Basic interpretation of MACD
1. Both the DIF line and the MACD line are above the 0 axis and continue to move upward, indicating that the market is currently in a bullish trend and there is a high probability that the market will continue to rise.
2. Both the DIF line and the MACD line are below the 0 axis and continue to move downward, indicating that the market is currently in a bearish trend and there is a high probability that it will continue to fall.
3. Both the DIF line and the MACD line are above the 0 axis but continue to move downward, indicating that although the current price is in a bullish trend, there is a high probability that it will usher in a wave of correction.
4. Both the DIF line and the MACD line are below the 0 axis but continue to move upward, indicating that although the current price is in a bearish trend, there is a high probability that it will usher in a rebound.
MACD itself is the difference and intersection of two moving averages, and the larger value of the EMA parameter in the indicator setting (that is, the preset value of EMA26) represents the "0 axis" in the indicator.
Interpretation of MACD Golden Cross/Death Cross, Top Divergence/Bottom Divergence
Because MACD has the characteristics of a moving average – trend direction, and is smoothed multiple times through exponential averaging, the MACD indicator can more accurately reflect the direction and changes of the market. The pointer is composed of two curves and a continuous column. The curve can be interpreted as a crossover of the moving average, and the length of the column can be interpreted as the force in that direction. Therefore, the signal it can convey is more comprehensive than that of general technical indicators. Its signal interpretation is as follows:
1. MACD Golden Cross
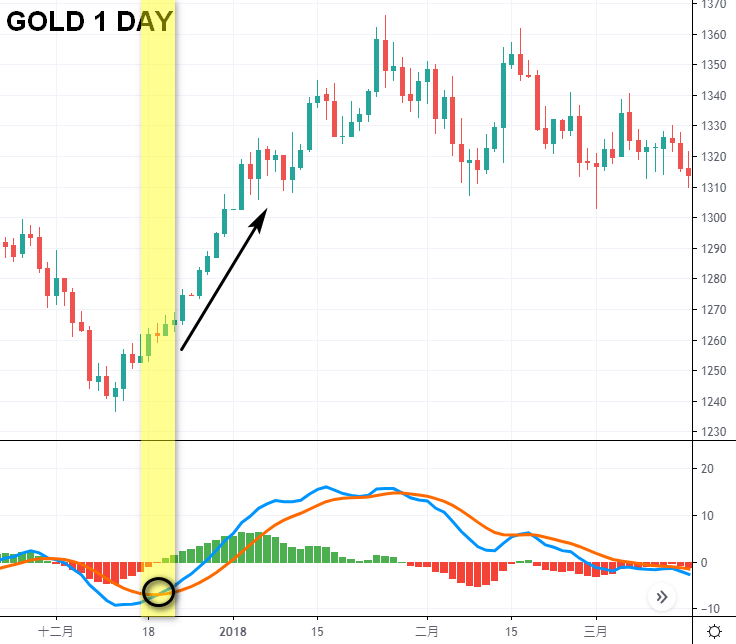
When the DIF line crosses the MACD line from bottom to top when it is below the 0 axis, and the column turns up from negative to positive, it means that this wave of market may have bottomed out, and there is a high probability of reversal and an upward trend. This is a kind of MACD golden cross, and it is recommended to enter long orders or exit short orders at this time.
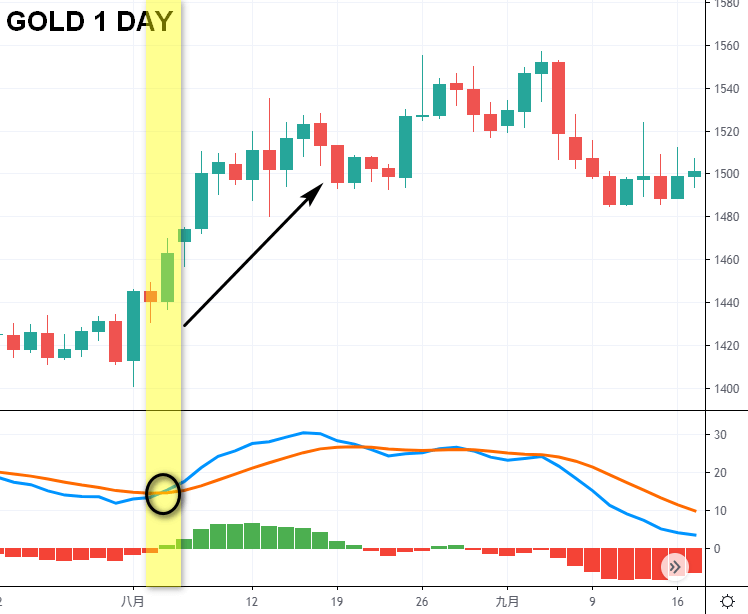
When the DIF line crosses the MACD line from bottom to top when it is above the 0 axis, and the column turns up from negative to positive, it means that this wave of callback may have been completed, and the market is likely to rise again. This is a kind of MACD golden cross. It is recommended to enter long orders or continue to hold long orders, or exit short orders at this time.
2. MACD Death Cross
When the DIF line crosses the MACD line from top to bottom and the column turns up and down (from positive to negative), it means that this wave of rebound may have been exhausted and the market is likely to fall again. This is a kind of MACD death cross. It is recommended to enter a short position or continue to hold a short position, or exit a long position at this time.
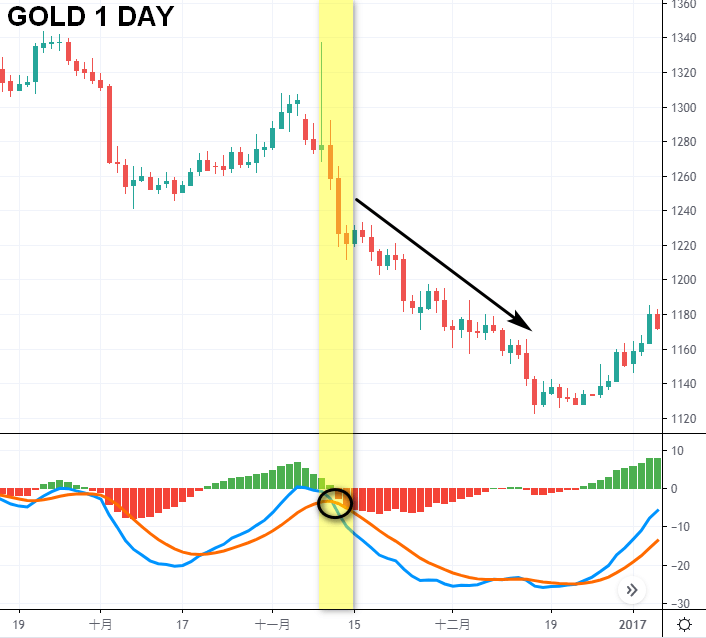
When the DIF line crosses the MACD line from top to bottom when it is above the 0 axis, and the column turns up and down (from positive to negative), it means that this wave of market may have peaked, and there is a high probability of reversal and a downward trend. This is a kind of MACD death cross, and it is recommended to enter a short position or exit a long position at this time.
3. MACD divergence
MACD divergence refers to the market trend being contrary to MACD, meaning that when the price hits a new high (low), MACD does not hit a new high (low) at the same time. This situation often comes from the market experiencing a long period of rise (fall), and the upward (falling) momentum has been exhausted, leading to a change in the market. Therefore, when a top (bottom) divergence occurs, there is a greater chance of a downward (upward) trend.
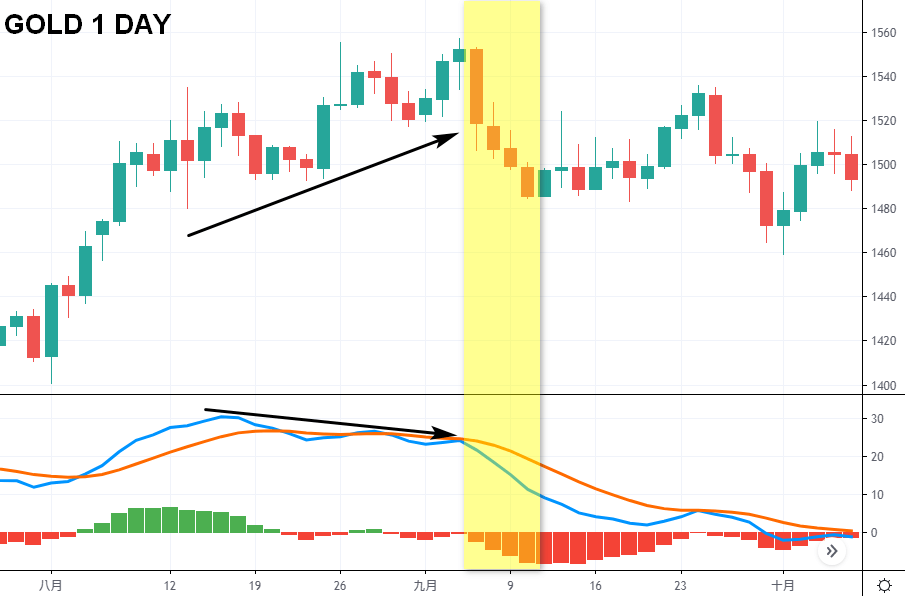
3 - 1) Top Divergence
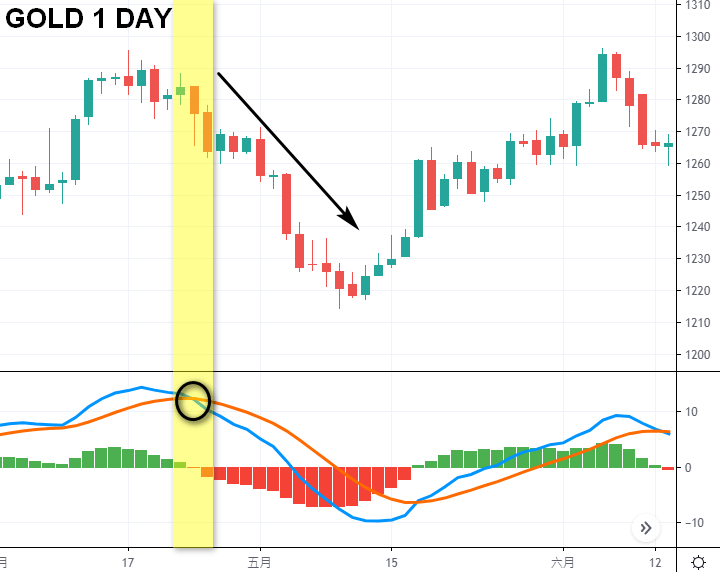
In the above figure, the market trend continues to hit new highs, but in the MACD indicator, the DIF line and MACD line failed to follow the price to hit new highs, and the high point moved downward instead, and the column failed to give relative momentum. This signal indicates that the market may have reached the top and there is a high probability of a reversal. Traders can exit long orders or enter short orders.
3-2) Bottom Divergence
In the above figure, the market trend continues to hit new lows, but in the MACD indicator, the DIF line and MACD line failed to follow the price to hit new lows, the low point instead moved upward, and the column also failed to give relative momentum. This signal indicates that the market may have bottomed out and there is a high probability of a reversal. Traders can exit short orders or enter long orders.
Can MACD be set on MT5?
However, investors should note that the MACD indicator of the MT5 platform is significantly different from that of general platforms in the market. In addition to the lack of fast lines, the drawing of the bars is also different. Investors are advised to find another chart website for reference.
Summary of MACD advantages and disadvantages
The MACD indicator is widely used in trading because it has more signals for investors to refer to. It not only has obvious golden or death crosses to determine market trends, but also has the length of the column to provide momentum signals. Moreover, the information noise provided by MACD is less than that of the moving average alone.
However, it should be noted that the MACD indicator also has the disadvantage of lagging. During consolidation, the fast and slow lines will be entangled, and the column may hover around the 0 axis. At this time, the indicator does not have much reference value. In addition, in the pattern of rising and falling, the MACD column may also fall below the 0 axis and then turn up (the same is true when the market rebounds after a deep drop). At this time, if you only rely on the MACD indicator to enter and exit the market, the possibility of losses will increase.
Therefore, when using the MACD indicator, investors must refer to other technical indicator tools to minimize the possibility of misjudgment and increase the chance of profit.