RSI is the abbreviation of Relative Strength Index in English. Its Chinese name is "Relative Strength Index". It was invented by technical analysis master Wilder in 1978. However, this Chinese name can easily lead investors to misunderstand it as a relative comparison between two different commodities. Therefore, it may be safer to call it "Buy-Sell Strength Index" in the foreign exchange market.
Buying represents the strength of the bulls, and selling represents the strength of the bears. If the strength of the bulls is stronger, the RSI indicator will move upward. On the contrary, if the strength of the bears is stronger, the indicator will move downward. The RSI formula is composed of the "number of days of increase and decrease" and "the magnitude of increase and decrease" of the same commodity. It mainly measures the magnitude of recent price changes, observes whether the price is overbought or oversold, and serves as a signal and basis for entry and exit.
RSI indicator formula and the meaning of its values
RSI shows the "ratio of buying and selling strength over a period of time". There are two formulas:
1. Using EMA (Exponential Moving Average) as calculation method

EMA (U,n) is the exponential average of the increase in n days
EMA (D,n) is the exponential average of the decline in n days
Therefore, it can be regarded as: {average value of the increase index within n days ÷ (average value of the increase index within n days + average value of the decrease index within n days)} × 100
2. Using SMA (Simple Moving Average) as the calculation method
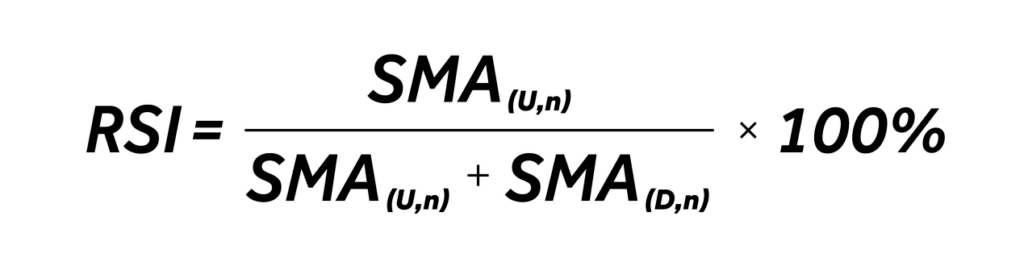
SMA (U,n) is the average value of the increase in n days
SMA (D,n) is the average value of the decline in n days
Therefore, it can be regarded as {average increase in n days ÷ (average increase in n days + average decrease in n days)} × 100
It should be noted that if there is no rise or fall, that is, the opening and closing prices are the same, then U representing an increase and D representing a decrease = 0, and 0 is substituted into the formula for calculation.
The results calculated by the two formulas are not much different, so the simpler SMA (simple moving average) is the mainstream calculation method in the market. Below we use the rise and fall of a line chart to calculate to demonstrate the formula.
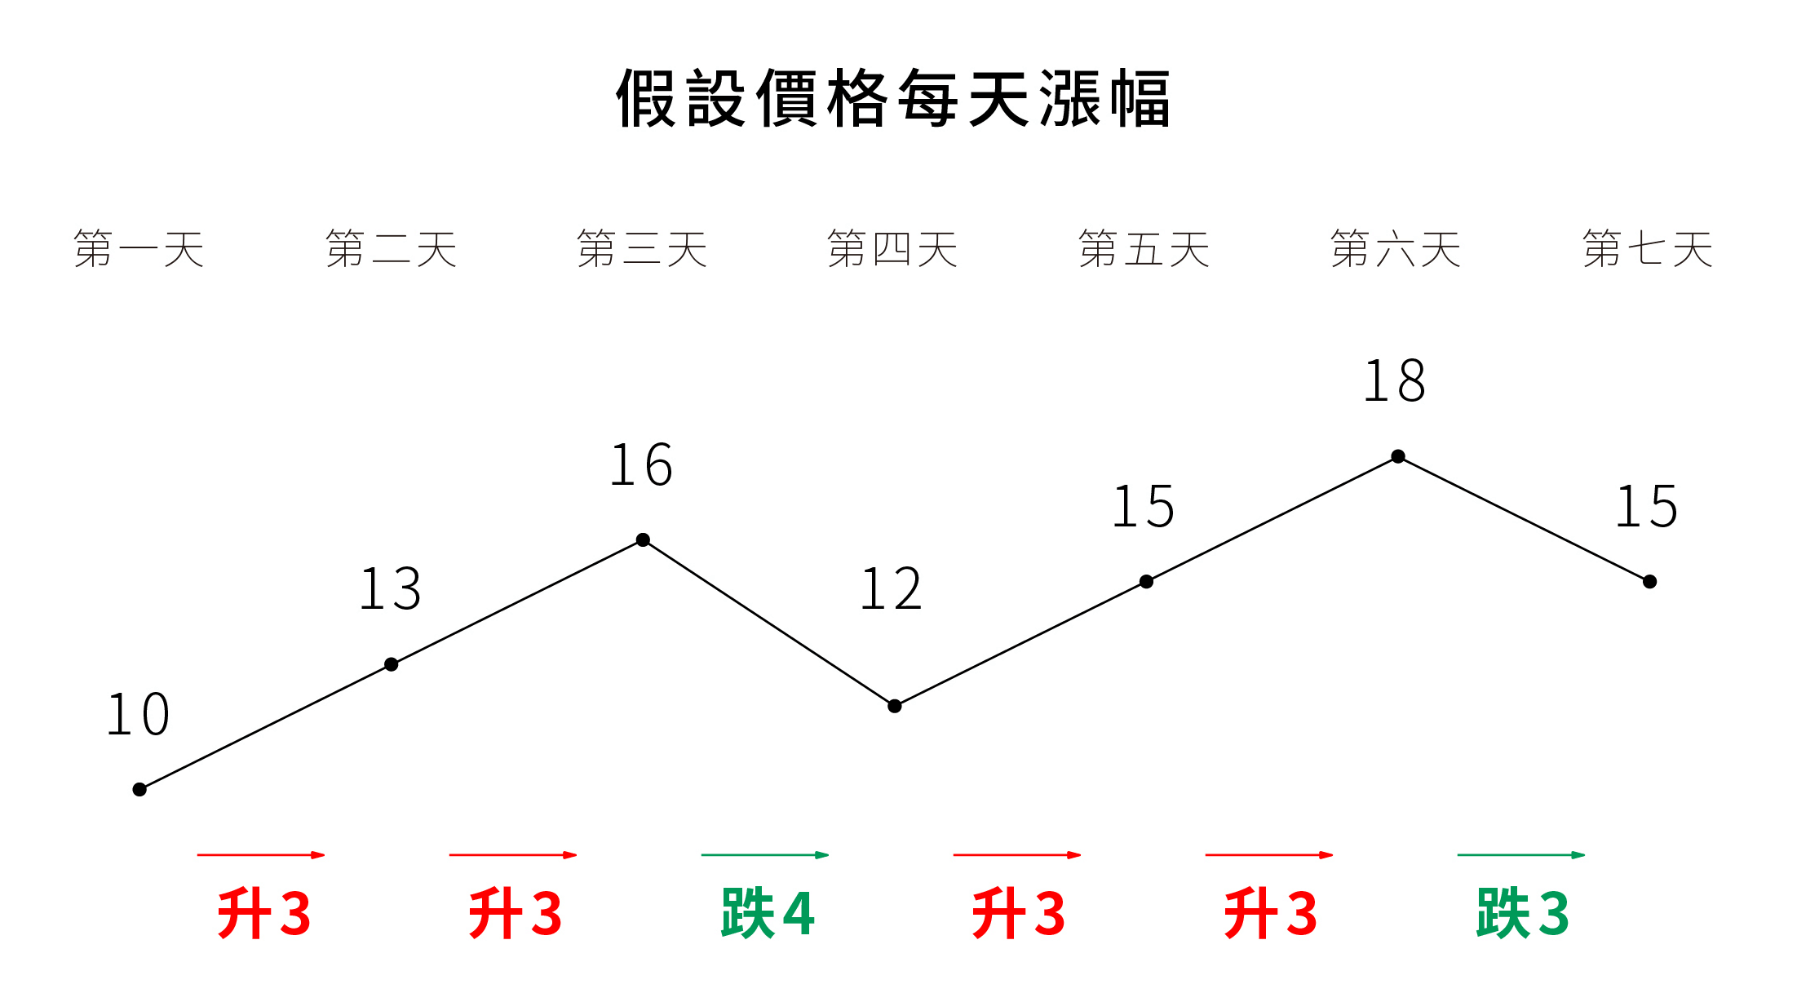
Take the 6 ups and downs RSI (6) that appeared in 7 days as an example:
Price change: $10>$13>$16>$12>$15>$18>$15
Step 1: Add up the rising prices and divide by 6. In the above example, the total increase is $12, and the calculation base is 6, so the average increase is $2.
Step 2: Add up the total price drops and divide by 6. In the above example, the total drop is $7, and the calculation base is 6, so the average drop is about 1.167.
Step 3: Substitute the formula into {average increase within N days ÷ (average increase within N days + average decrease within N days)} × 100
=>>{2÷(2+1.167)} ≒ 0.632
From the above example, we can see that due to the calculation formula, the RSI indicator will fall between 0-100. When the RSI>50 during the set period, it means that the bulls are stronger, the trend is stronger, and the average increase is greater than the average decrease; but if the average decrease is greater than the average increase, the RSI will be <50, and the bears are stronger at this time, and the trend is downward. In addition, it should be noted that if the bulls and bears are exactly the same, the RSI will also fall exactly at 50 due to the calculation formula.
Next, we will introduce why RSI is called a counter-trend indicator. When RSI enters 80 (or 70), investors need to pay more attention. Although the bullish momentum is very strong, it is likely to face a correction at the end of its strength. Therefore, this area is called the "overbought zone", which can be regarded as a signal for shorts to enter the market. On the contrary, if RSI falls to 20 (or 30), this area is called the "oversold zone", which means that the market may experience irrational selling, and the price will have a high probability of rebounding, which can also be regarded as an opportunity for longs to enter the market.
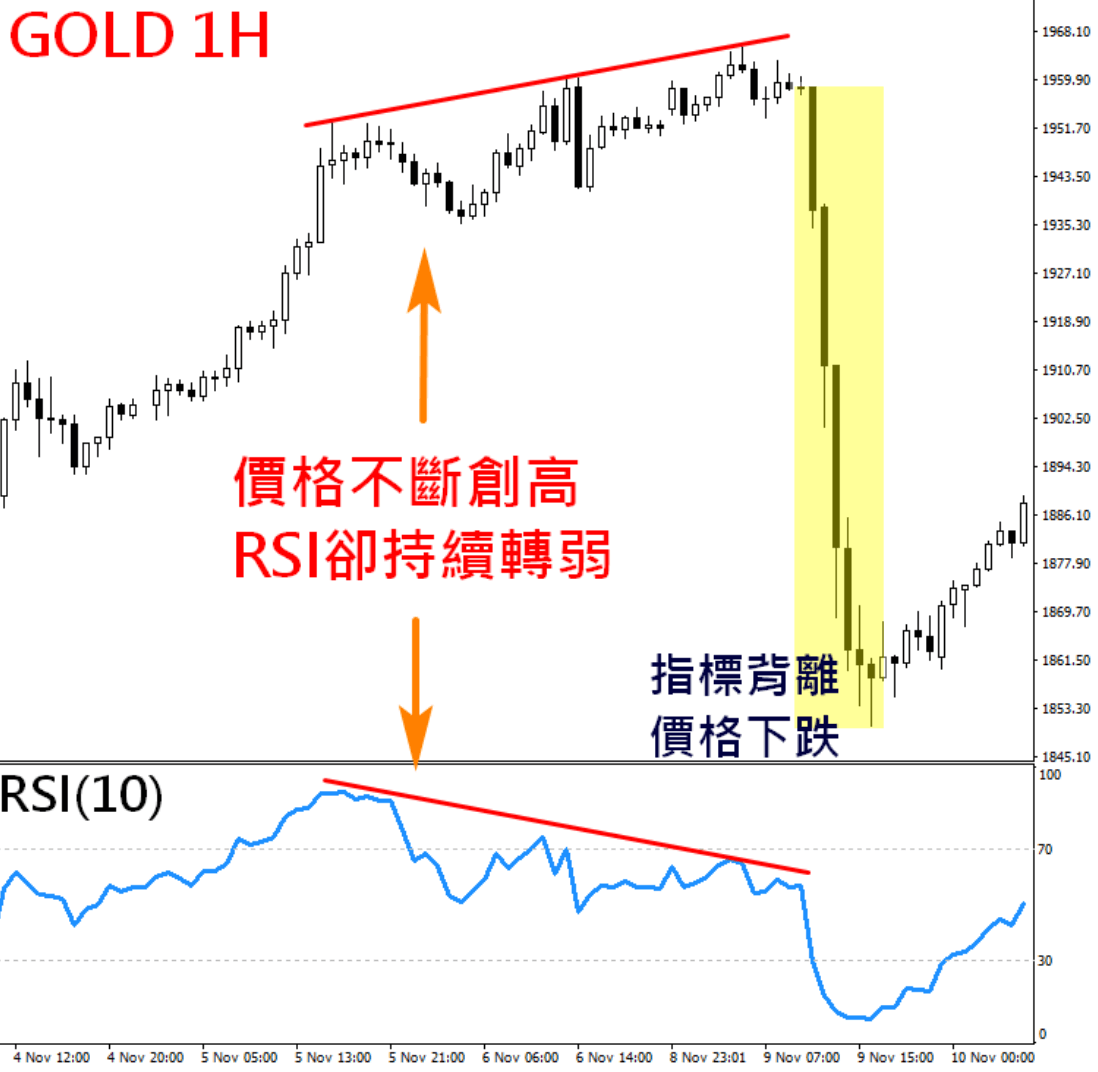
Divergence of RSI
Regardless of the technical indicator, when the price is rising or falling, the indicator value should also rise or fall normally in the direction of its development. However, if the price reaches a new high or a new low, but the indicator does not reflect it, this is called divergence. Judging from historical data, divergence usually produces band-like highs and lows.
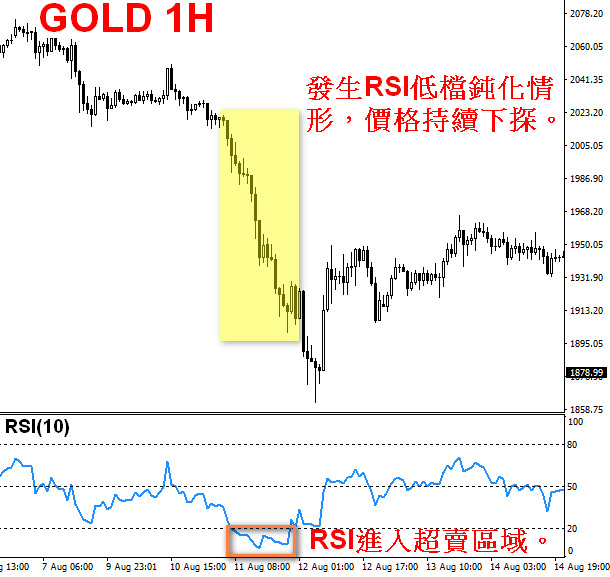
RSI blunting
The passivation of RSI means that the commodity price has entered the overbought (oversold) area, and the price may fall (rebound) at any time. Generally speaking, this is a good opportunity to sell (buy). However, sometimes the price trend is strong. When entering the overbought (oversold) area, the price continues to rise (fall) and the amplitude becomes larger and larger, while the rise (fall) amplitude of RSI will become smaller and smaller, forming an upward parabola shape.
Limitations of the RSI indicator
RSI, like most technical indicators (KD, MACD), is composed of historical prices, which may cause lag. Different technical indicators are of course also sensitive to prices to different degrees. The more sensitive the technical indicator, the shorter the time to enter and exit the market, but it is easy to exit the market early due to short-term market fluctuations. RSI is also one of the more sensitive indicators due to its calculation method, so investors cannot simply use RSI as a signal to buy or sell.
How to set up the RSI indicator in MT5 (Metatrader 4)?
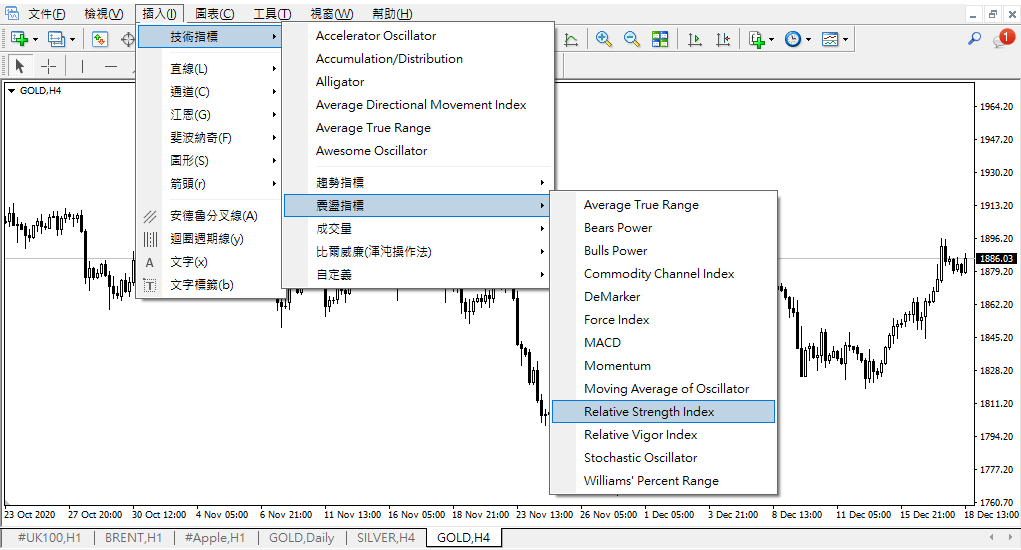
After opening MT5, go to Insert → Oscillator → Relative Strength Index in the software.
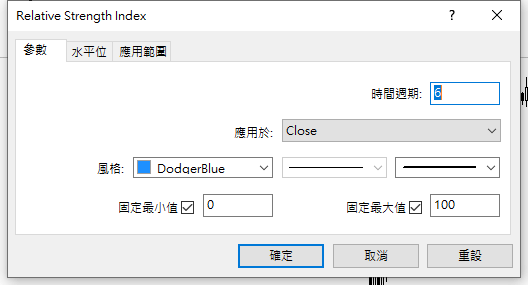
Click it to set the desired period value from the parameters.
Summarize
When Wilder created the RSI technical indicator, he mainly used the contrarian view to enter the market (execute the sell order in the overbought zone and the buy order in the oversold zone). However, as it has evolved to this day, the trend-following view is also widely used in trading strategies (50 is the long-short watershed). However, RSI also has the following issues that need attention:
1.RSI can only be used as a warning signal. It does not mean that the price will develop 100% in the direction of the pointer. It needs to be combined with other technical indicators (such as moving average) to improve the success rate of the transaction.
2.RSI is not smooth. If the market encounters a major event that causes large fluctuations in prices, the RSI indicator may lose fairness.
3.RSI is a ratio indicator, so it is not suitable for judging trend changes. When the market enters a sideways trend, its value will hover around 50, making it difficult to provide investors with trading signals.