K-line is the basis of all technical patterns. Investors must first understand K-line before entering the financial market. K-line is believed to release long and short signals in the market, allowing us to quickly judge the market conditions and investor mentality, and therefore it is highly concerned by traders.
Before explaining, we need to understand that in the market, the use of K-line colors varies according to local habits. In Greater China or Japan, people are used to using red for rising and green for falling, while in the international market, people are used to using green for rising and red for falling. In other markets, there are also red and blue, red and black, etc. In this article, we will use the red for rising and green for falling diagram to show you the structure of K-line and how to use K-line patterns to determine the long and short positions in the market.
Understanding K-line
K-line is also called candlestick line, yin-yang line or red and black line. K-line can help us quickly judge the current market situation. Its composition is the opening price, closing price, highest price and lowest price. We first draw the entity with the opening price and closing price, mark the highest price and lowest price and connect them with the entity, and then we can draw the upper and lower shadows. In order to interpret the market situation within a day more quickly, if the closing price is higher than the opening price, it means the market is rising, and the entity will be filled with red (yang line). On the contrary, if the closing price is lower than the opening price, it means the market is falling, and the entity will be filled with green (yin line).
K-line time period application
Theoretically, any time period can form a K-line. The most common time period is measured in "hours", and there are also time periods measured in "days". The more time periods used by most investors, the more valuable the K-line pattern is, which means that the established trading strategy may be more stable. The length of the observation time unit is related to the trading strategy or method constructed by the investor. The shortest unit is measured in "seconds" and the longest unit is measured in "months".
Introduction to common K-line patterns
In K-line analysis, each K-line has its meaning. Whether it is the size of the body or the length of the upper and lower shadows, it can provide information for us to interpret the long and short trends of the market. No matter what time period is used, after a K-line is completed, it also expresses the long and short sentiment of the market to a certain extent. This article will introduce various K-line patterns (using daily as an example of the time period).
(The red bars in the following candlestick chart represent an increase, and the green bars represent a decrease)
Five common bullish signals of K-line
In a downward trend, the candlestick pattern may send some signals to tell traders that the future trend may reverse at the bottom, which is also a good time to buy at a low point.
1. Hammer
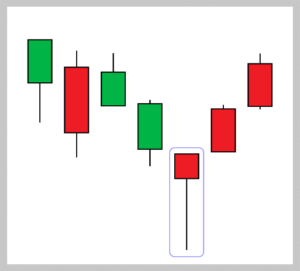
If the hammer candlestick pattern appears in a downward trend, it means that the bears have a strong force after the market opens, causing the price to fall sharply, but the decline is not sustainable. Because the price is supported by many parties at a low level, the closing price will be slightly higher than the opening price after the market closes, and the lower shadow line is 2 to 3 times longer than the candlestick body. Sometimes a shorter upper shadow line will appear. The future market trend is likely to bottom out and rebound, which is a bullish signal.
2. Invert the hammer
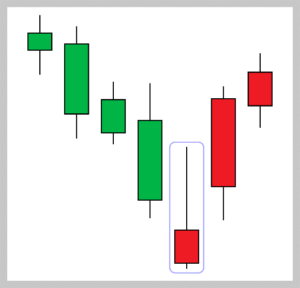
If the inverted hammer candlestick pattern appears in a downward trend, it means that the short side has a strong force after the market opens, and the price jumps down, but the price is supported by buyers at a low level. However, at the same time, the selling pressure from above is large, and the upward trend fails to last long, leaving an upper shadow line. After the market closes, the closing price will be slightly higher than the opening price, or close to the opening price. The future trend is likely to bottom out and rebound, which is a bullish signal.
3. Morning Star
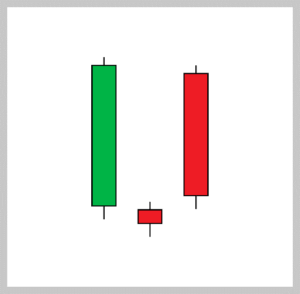
The Morning Star is composed of three candlesticks, which usually appear after a period of downward trend. The first one is a large green candlestick with heavy selling pressure, indicating that the short-term momentum is relatively strong; the second one is a cross star or a spindle after a gap-down opening, indicating that the short-side momentum has slowed down; the third one is a large red candlestick with strong buying after a gap-up opening, indicating that the bulls have regained the momentum. The future trend is likely to bottom out and rebound, which is a bullish signal.
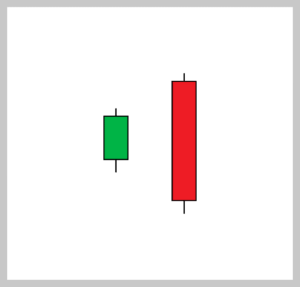
4. Three Red Soldiers (Three White Warriors)
Three Red Soldiers is composed of 3 red candlesticks, and the closing price is higher every day, and the closing price every day is the highest point or close to the highest point. If the K-line pattern of Three Red Soldiers appears in a downward trend, it represents a strong signal of bullish counterattack. The future trend is likely to bottom out and rebound, which is a bullish signal.
5. Broken feet and pierced head
It is composed of a green K with shadows from the previous day, and a red K that opened low and closed high afterwards. However, the red K entity partly covers the entire green K including its shadows. It means that after the opening of the day, the short side continued the trend of yesterday, causing the price to open low, but at a low level, the long side actively entered the market, pushing up the price significantly until the closing, forming a bullish engulfing. The future trend is likely to bottom out and rebound. If it appears after a wave of decline, it is a strong bullish signal.
Five common negative signals of K-line
In an upward trend, the candlestick pattern may send some signals to tell traders that the future trend may reverse at the top, which is also a good time to enter the market at a high point.
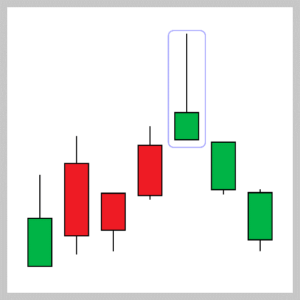
1. Hanging
If a hanging candlestick pattern appears in an upward trend, it means that after the opening of the day, the bulls continued the trend of yesterday, but were attacked by the bears at a high level, so that the closing price was slightly lower than the opening price and left a long lower shadow. The length of the shadow is 2-3 times the length of the candlestick body, and sometimes a shorter upper shadow will appear. The future trend is likely to rise and then fall, which is a bearish signal.
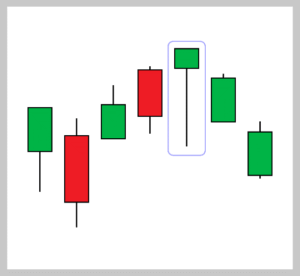
2. Shooting Star
If a shooting star candlestick pattern appears in an upward trend, it means that after the opening of the day, the bulls continue the trend of yesterday, causing the price to open higher (not necessarily open higher), but the bears attack at a high level, causing the closing price to be lower than the opening price, leaving a long upper shadow line, which is 2-3 times the length of the candlestick body, and sometimes a shorter lower shadow line. The market is likely to rise and fall in the future. If it appears at the top of a wave of upward trend, it is a strong negative signal.
3. Evening Star
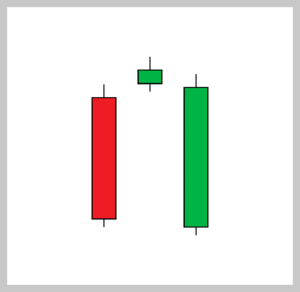
The Evening Star is composed of three candlesticks, which usually appear after an upward trend. The first candlestick is a strong red candlestick, indicating that the bullish momentum is relatively strong in the short term; the second candlestick is a cross star or a spindle after a gap-up opening, indicating that the bullish momentum has slowed down; the third candlestick is a strong green candlestick after a gap-down opening, indicating that the bears have regained the momentum. The future trend is likely to peak and fall, which is a bearish signal.
4. Three Green Soldiers (Three Flying Crows)
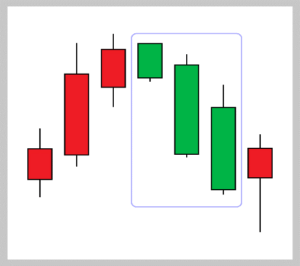
Three Green Soldiers is composed of 3 green K bars, and the closing price is lower than the previous day, and the closing price of each day is the lowest point or close to the lowest point. If the K-line pattern of Three Green Soldiers appears in an upward trend, it represents a strong short-term counterattack signal, and the future trend is likely to peak and fall, which is a negative signal.
5. Head and feet
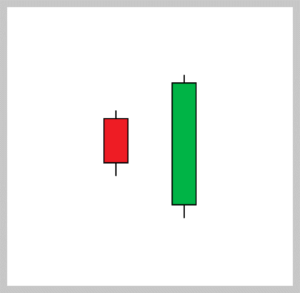
It is composed of a red K with shadows from the previous day, and a green K that opened high and closed low afterwards. However, the green K entity partly covers the entire red K including its shadows. It means that after the opening of the day, the bulls continued the trend of yesterday, causing the price to open higher, but was actively suppressed by the bears at a high level, pushing the price down sharply until the closing, forming a bearish engulfing. The future trend is likely to peak and fall back. If it appears after a wave of rising trends, it is a strong bearish signal.
Four types of candlestick patterns that indicate continuation or change
The following four K-line patterns indicate that the market trend may continue or may change, so traders need to pay more attention when entering the market.
1. Doji
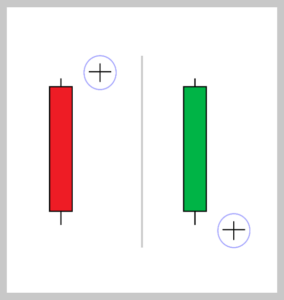
The cross star indicates that the K-line of the day has the same or close opening and closing prices, and the longer the upper and lower shadows, the more intense the competition between long and short positions. However, the future trend is unclear. It may be a continuation of the previous trend or a precursor to a change in the market. If the cross star appears after the red K, it means that the momentum of the long side may be fading, and it is waiting for more breakthroughs in the market to rise further. If the cross star appears after the green K, it means that the momentum of the short side may be fading, and it is also waiting for more factors to intervene before confirming the further decline.
2. Spindle (also known as gyroscope)
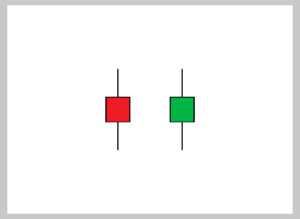
The candlestick with upper and lower shadows and a small body is called a spindle, which is more common in a consolidating market. Whether the body is red or green is not very important, it just means that the momentum of both bulls and bears has not yet been expressed, neither side has a clear advantage, and the current market situation is unclear. If a spindle is formed in an upward trend, it means that the market bulls may not have enough momentum and may be counterattacked by bears. On the contrary, if a spindle is formed in a downward trend, it means that the market bears may have been exhausted and there is a greater chance of a bull reversal.
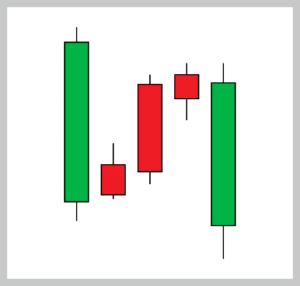
3. Three rising methods
The rising three method refers to the appearance of a longer red K-line in an upward trend, followed by three shorter K-lines (either positive or negative, but generally green K-lines are the main ones). However, the condition is that the three shorter K-lines, whether their bodies or shadows, must be within the trading range of the first long red K-line (including the shadow). Finally, a red K-line appears, and its closing price is higher than that of the first red K, indicating a breakthrough in the future and the continuation of the upward trend.
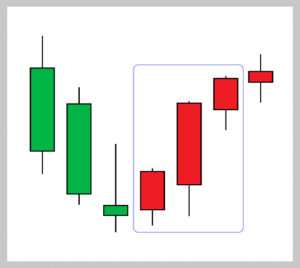
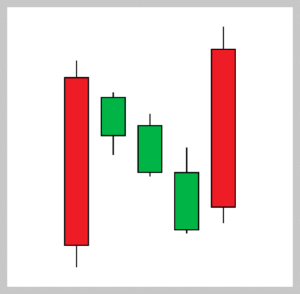
4. Three methods of decline
The descending three method refers to the appearance of a longer green K-line in a downward trend, followed by three shorter K-lines (either positive or negative, generally red K-lines), but the condition is that the three shorter K-lines, whether the bodies or shadows, must be within the trading range of the first long green K-line (including the shadows). Finally, a green K-line appears, and the closing price is lower than the closing price of the first green K, indicating a breakthrough in the future and the downward trend will continue.
The above-mentioned K-line patterns are only some of the more widely known ones and are considered by investors to have a higher predictive power. There are also some less popular K-line patterns with different names for investors to refer to. If combined with other technical indicators in trading and the judgment of the overall trend pattern, the application of K-line can further strengthen investors' trading strategies.