To analyze the investment market, the use of charts and technical indicators is indispensable. There are several most popular technical indicators, and one of them that investors have come into contact with is the KD line. The KD line is one of the most widely used technical analysis indicators, and there must be reasons and advantages. This article will introduce some basic knowledge about the KD line.
1.What is the KD line?
KD line is also called KD indicator or stochastic indicator, and is called "Stochastic Oscillator" in English. It was invented by American trader George Lane in 1957 and used in the futures market. It is now widely used in the foreign exchange market. KD line can help traders easily understand whether the price trend is overbought or oversold, and then choose a better time to enter the market. The calculation method of KD line is relatively complicated, including the highest price, lowest price and closing price within the set period.
Below we explain the calculation formula of KD value in terms of "day":
The KD indicator is mainly used to present the strength and weakness trend of the price in the past period of time. The calculation method requires calculating the RSV value first, and then calculating the K value (called the fast line) and the D value (called the slow line). Traders then use the high and low positions, death crosses or golden crosses of the KD line as the basis for entering and exiting the market.
KD indicator formula
RSV = (Today's closing price - Lowest price during the set period) ÷ (Highest price during the set period - Lowest price during the set period) * 100
RSV (Row Stochastic Value) is also known as "immature stochastic value". It can be understood as "the ratio of the distance between the closing price and the lowest price on the last day of the set period to the distance between the high and low fluctuations during the set period". The set period is usually 9 days or 14 days.
With RSV, we can calculate the current K value and D value based on the weighted calculation. The formula is:
Today's K value = 2/3 × previous day's K value + 1/3*today's RSV
Today's D value = 2/3 × previous day's D value + 1/3* today's K value
(If there is no K value or D value of the previous day, 50 can be substituted into the calculation)
(When calculating K and D values, a smoothing value needs to be set, usually 3)
In essence, the D value is the moving average of the K value, which is a smoothed version of the K value.
K value:
It is composed of the weighted average of today's RSV value and yesterday's K value. It is more affected by the current price, so the fluctuation will be more sensitive, so it is also called the "fast line".
D value:
It is composed of the weighted average of today's K value and yesterday's D value. Because it has undergone two weighted averages, it will be less affected by the current price, so it is also called the "slow line".
The main assumption of the KD indicator is that when the price is in an upward trend, the closing price will move closer to the recent highest price; when the price is in a downward trend, the closing price will move closer to the lowest price of recent fluctuations. Therefore, the higher the calculated KD value, the closer today's closing price is to the recent highest price; the lower the calculated KD value, the closer today's closing price is to the recent lowest price.
2. How to read the KD line
Because of the way the KD value is calculated, its value will be between 0-100; above 80 is considered the overbought zone, and below 20 is considered the oversold zone (some traders define the range as above 70 and below 30.)
K value>D value: represents that the current price is on the rise.
K value < D value: represents that the current price is in a downtrend.
KD value>50: represents the current bullish pattern.
KD value <50: represents the current short side pattern.
The KD value is in the overbought zone: it means that the bull-led rising market has continued for some time, but the price trend may have deviated from the normal fundamentals, which means that the price may adjust downward, triggering a decline.
The KD value is in the oversold zone: it means that the bearish-led decline has continued for some time, but the price trend may have been overly pessimistic, which means that the price may adjust upward and trigger a rebound.
Signal 1: Golden Cross and Death Cross
Although the KD values will develop in the same direction, they may be faster or slower due to different calculation methods. Different types of crossovers will appear between the two, which can also be regarded as buy or sell signals.
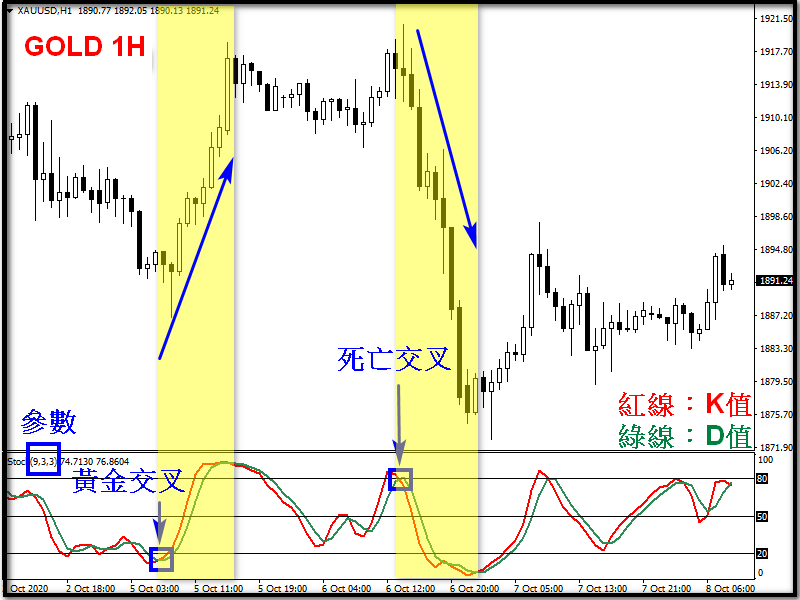
Golden cross: When the K value breaks through the D value from a low level and forms a golden cross, it means that the price has encountered a turning point and there is a probability of rising in the short term.
Death cross: When the K value breaks through the D value from a high level and forms a death cross, it means that the price has encountered a turning point and there is a probability of a short-term decline.
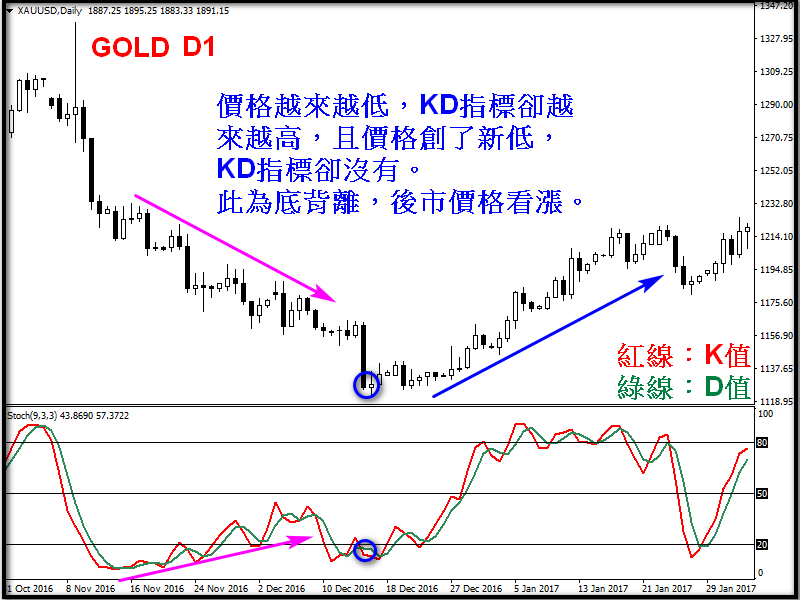
Signal 2: Divergence
Sometimes the price is inconsistent with the signal of the KD indicator. For example, when the price is getting higher and higher, the KD value is getting lower and lower. This is called "top divergence", and the price may face a period of decline; or when the price is getting lower and lower, the KD value is getting higher and higher. This is called "bottom divergence", and the price may face a period of rebound. When the market deviates, it is regarded as a precursor to an imminent reversal, and traders need to pay more attention.
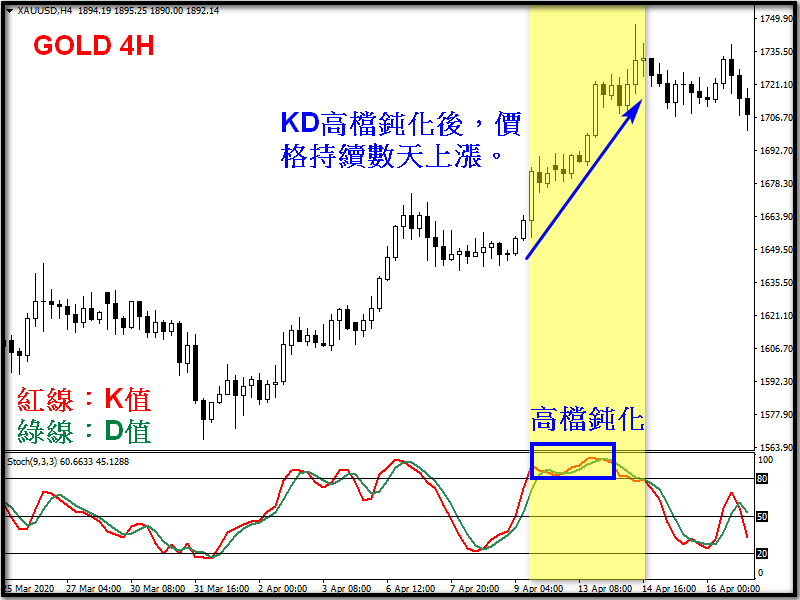
3. Limitations of KD indicator
Although the KD indicator has a wide range of applications, it also has its limitations. Due to the calculation method of KD, if the price develops strongly in a certain direction over a period of time, the KD indicator will be difficult to reflect the high and low prices of the past period of time, making the KD value remain in the overbought area (above 80) or oversold area (below 20) for a long time. Whether a golden cross or a dead cross occurs, it loses its meaning, which is also called "passivation". However, there is also a saying that due to the extreme price trend, we should follow the trend and chase the price.
Notes on KD pointer
A. Short circuits are prone to noise
The application of the KD indicator covers the highest and lowest prices within a certain period of time, so it can sensitively reflect price changes. However, due to parameter setting issues, it is too sensitive to prices in the short and medium term. This is the most criticized aspect of the KD indicator by traders.
B. It is easy to exit early before a big wave of market
Because KD is prone to blunting when the market fluctuates greatly, the signal will be very chaotic during a one-sided strong market, making it difficult for traders to enter the market.
C. Index Optimization
As mentioned before, the KD indicator is a medium- to short-term technical analysis. When the market fluctuates violently, frequent buying and selling noise may occur. At this time, traders need to use medium- and long-term indicators such as moving averages for interpretation, or modify the preset parameters (the most common ones are (9,3,3)) to avoid the frequent occurrence of noise.
4. Application of KD line with MACD
Here is a brief introduction on how to read MACD:
MACD consists of a column and a slow line, with a dividing line in the middle with a value of 0. A column above 0 represents a bullish pattern, and a column below 0 represents a bearish pattern. When the column crosses the slow line from bottom to top, it represents a golden cross (there is a probability that the short-term price will rise), and when the column crosses the slow line from top to bottom, it represents a dead cross (there is a probability that the short-term price will fall).
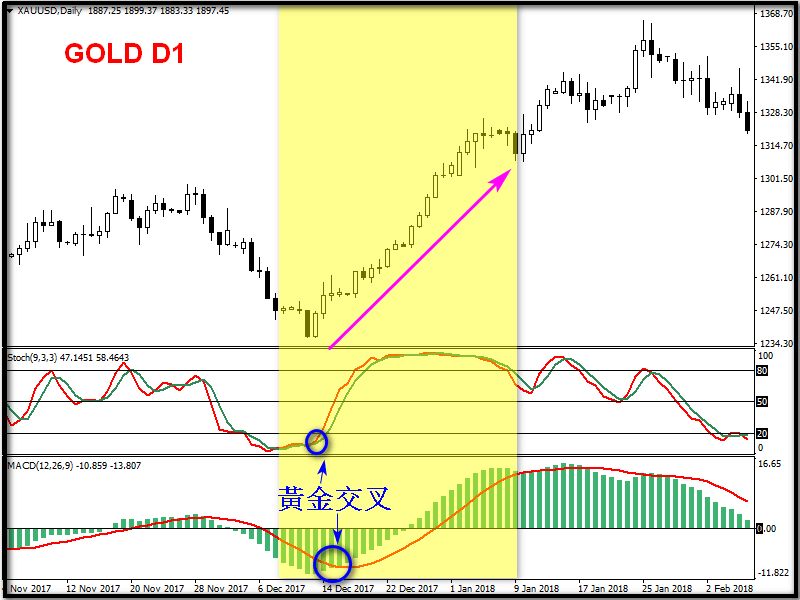
Both the KD indicator and the MACD indicator showed golden cross signals, and the price started a strong upward trend after the KD high-end passivation and the MACD column turned over the 0 axis.
The above KD value is currently the most commonly used by traders. It is a slow stochastic indicator (some call it a fast version) that has been developed and improved for many years. In the actual investment market, KD is classified into a fast stochastic indicator (Fast Stochastic Oscillator) with only two parameters, a slow stochastic indicator (Slow Stochastic Oscillator) and a full stochastic indicator (Full Stochastic Oscillator) with a J value (3K - 2D = J) to obtain the deviation between the K value and the D value as a reference. Generally speaking, the direction of trend analysis is the same, but the parameter setting and smoothing process are different, so I will not discuss it here.