Whether you are a foreign exchange investor with some trading experience or a novice who has just entered the foreign exchange market, if you have not studied finance, you will always feel unfamiliar when you see the constantly fluctuating trend chart at first, and you want to participate in the market but don’t know how to start.
At first glance, the market fluctuations seem to be disorderly, but in the almost random fluctuations, there are some special rules. Therefore, the "technical analysis" we often hear about is actually an attempt to find a specific "regularity" in such "randomness". Through the accumulation of records, tracking, sorting and summarizing over time, it is not difficult to find that the foreign exchange market is particularly strongly related to technical indicators, and individual trends are also particularly sensitive in the prediction of some indicators.
Because technical indicators are effective, they are gradually becoming more popular and eventually help us trade every day. This article will briefly introduce the four most common foreign exchange technical indicators to readers.
1 / MA (Moving Average)
If you are a novice entering the market, it is generally recommended to use MA, that is, Moving Average. MA is easy to understand and has a powerful trend tracking function, making it the most widely used indicator in the foreign exchange market.
Definition and application of moving average
We often see terms such as monthly moving average, weekly line, and annual line in analysis articles. In fact, they are all talking about moving averages. Taking the 5-day moving average as an example, it records the closing prices of the past five trading days. After adding up and taking the average, we can get the value of the 5-day moving average. If today's market quotation is higher than the 5-day moving average, it means that the upward force in the short term is strong, and it is possible to evolve into an upward trend. At this time, you can follow the trend and focus on long positions.
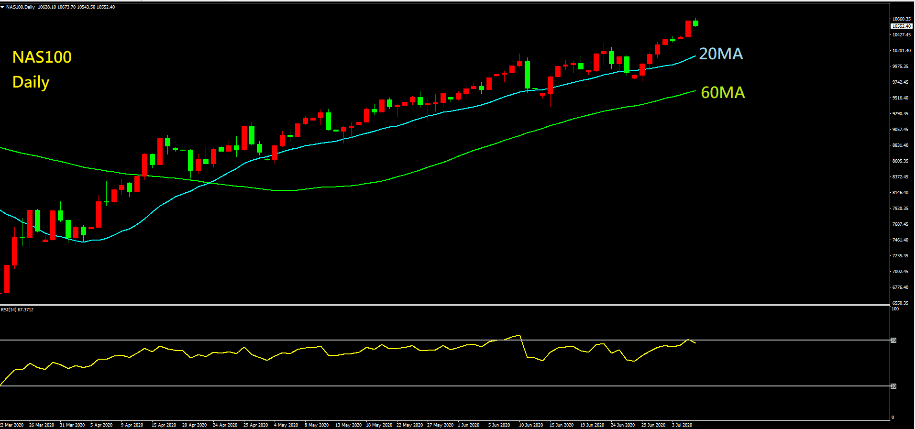
As shown in the above figure, the trend continues to be above the moving average, and the price continues to move up, so we can immediately determine the main trend direction through the price position around the moving average, and thus decide the direction of operation. The simplicity and convenience provided by the moving average is also the reason why it is popular among novices in the foreign exchange market.
Long-term and short-term moving averages are often used together to help traders find the best time to buy and sell foreign exchange.
Advantages of MA
When the market trend is clearer, using moving average indicators can help you make efficient and profitable buying and selling decisions.
Disadvantages of MA
If the market trend is not obvious, the moving average will easily lose its reference value, and it is easy to make mistakes when using the moving average to trade.
2 / RSI (Relative Strength Index)
Just now we mentioned that there are trends in the market, but the trend cannot always be upward or downward. One day, the upward trend will end and fall, and the downward trend may gradually come out of the trough and rise. So how do we judge the trend and when there will be a turning point? At this time, RSI (Relative Strength Index), that is, the relative strength index, can provide a good reference.
Definition and Application of RSI
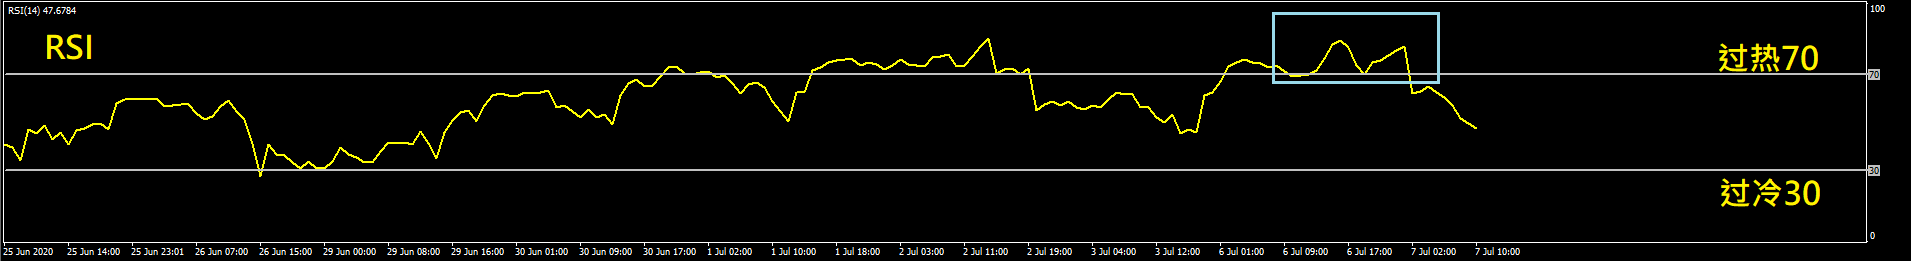
Generally speaking, the most common parameter of RSI is 14, and the current trend is judged by the changes in the closing prices in the recent 14 days. The RSI indicator has levels of 30 and 70 (as shown in the figure above). When the RSI is above 70, it means that the recent rise is too strong and has reached the level of over-inflation, and the subsequent trend is likely to turn downward. On the contrary, if the RSI is lower than 30, it means that the recent decline is too violent and has reached the level of oversold, and the subsequent trend is likely to rebound upward.
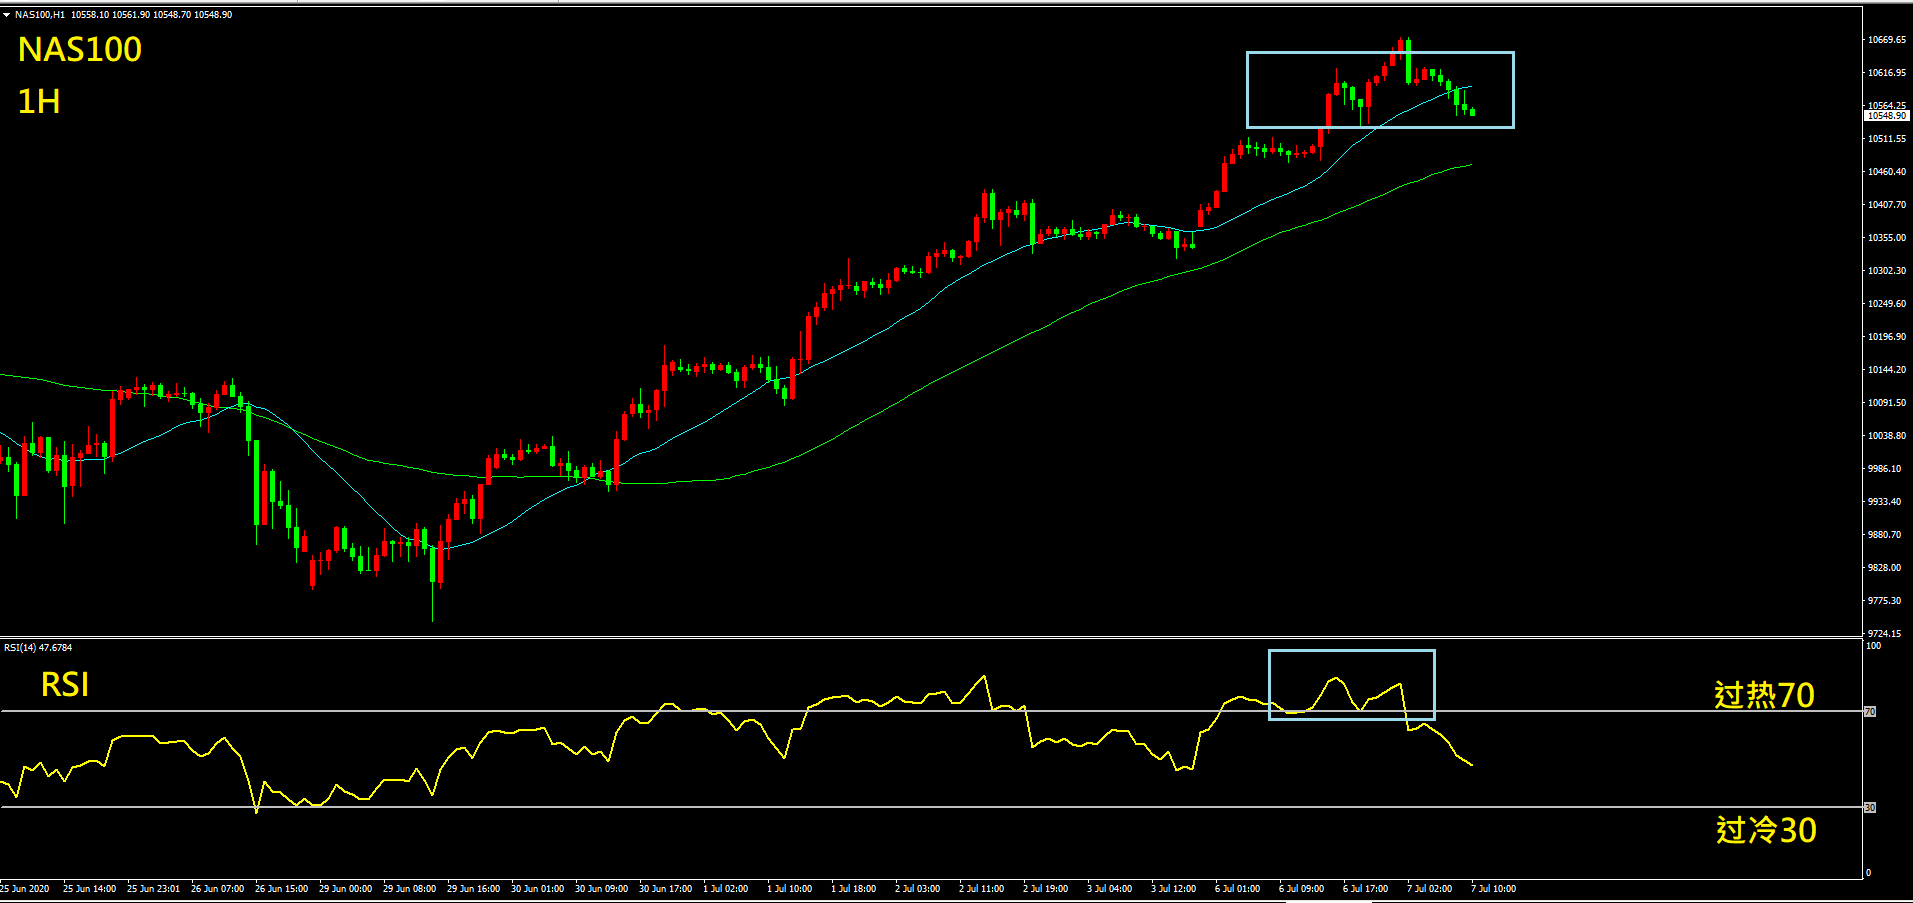
As shown in the above figure, the RSI pointer has reached the overheated area above 70, and the upward trend is an upward trend. Then we can infer that the next trend may turn downward. At this time, we can take profit of our previous long position, but it is not recommended to chase long operations.
Advantages of RSI
Generally speaking, the signal is more accurate when the RSI is below 30 or above 70. Therefore, if you can use the RSI indicator properly, you can avoid the risk of being too aggressive in foreign exchange trading but encountering a market reversal. If the RSI is between 30-70, it is not very meaningful and can be ignored.
Disadvantages of RSI
In an extremely strong trend (one-sided market), the RSI may stay below 30 or above 70 for a long time, at which point the RSI loses its reference value.
3 / STOCHASTICS (Oscillator/KD indicator)
The oscillator indicator is also called the KD indicator. Generally, the most common parameter is 9 days. It is a relatively sensitive and fast indicator among the indicators in the attached figure. Compared with the 14-day parameter of the RSI indicator, it moves slightly faster, but the usage of the two is roughly the same.
Definition and application of oscillator indicators
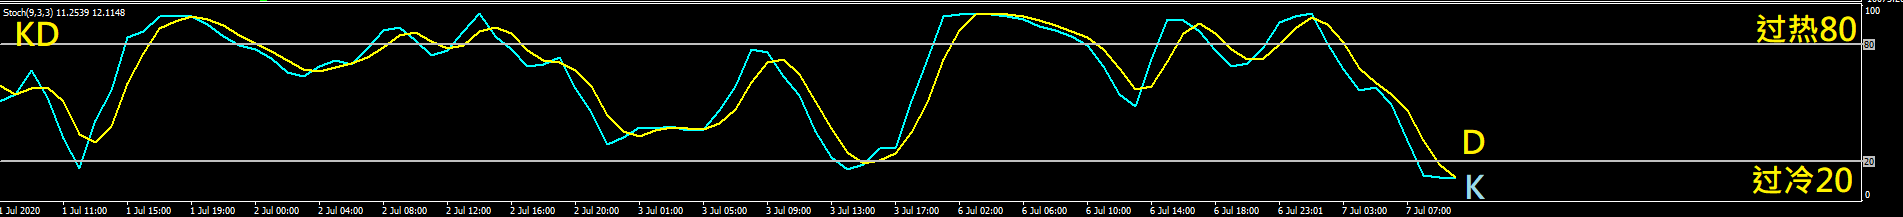
The difference between KD and RSI is that the KD indicator consists of two lines, namely the faster K line and the slower D line. The subsequent price changes are judged by the position and method of the intersection of the KD lines. When K crosses the D line from bottom to top, it is considered a "golden cross", which is a sign that the price is about to rebound upward; if K now crosses the D line from top to bottom, it is a "death cross", which is a precursor to the subsequent market decline.
Similar to RSI, KD also has horizontal lines of overcooling (20) and overheating (80). Therefore, when KD forms a golden cross below 20, it means that the decline is about to end and the market will rebound upward. If it forms a death cross above 80, it means that the rise has temporarily exhausted and is about to fall back.
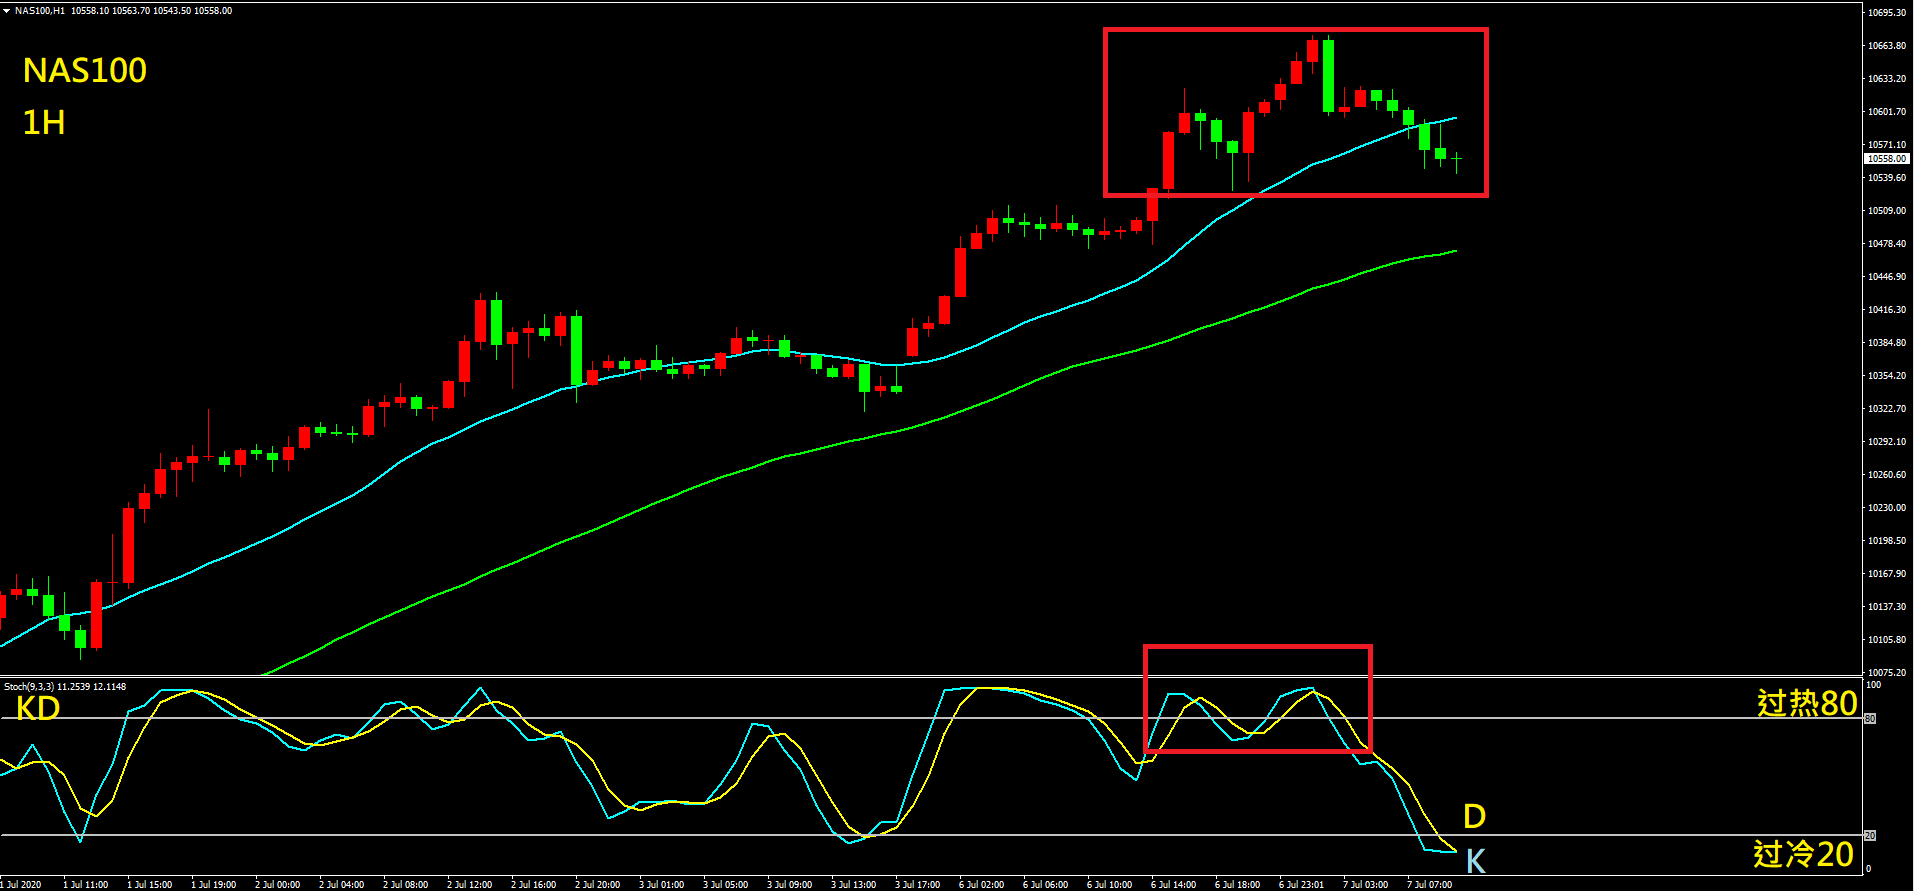
As shown in the above figure, as the trend rises, the KD indicator also reaches the overheated area. Therefore, it is reasonable to speculate that there should be a downward correction next. At this time, you can effectively avoid chasing more and the risk of long orders being trapped at high points.
Advantages of KD
Generally speaking, the golden cross below 20 and the death cross above 80 of KD are more valuable for reference, while the cross between 20-80 does not need to be paid too much attention. If KD can be used properly, most of the risks of market reversal can be avoided.
At the same time, we mentioned that KD is more sensitive than the RSI above because of its shorter cycle. If we compare the actual charts of the two indicators, we can find that KD sends out downward correction signals faster than RSI. Therefore, KD is more suitable for aggressive investors who want to seize the opportunity.
Disadvantages of KD
Although KD is sensitive and sends out buy and sell signals quickly, it is more prone to false signals and sometimes the frequency of errors is higher. In terms of application, it pays more attention to the experience and accuracy of consumers' analysis, so foreign exchange trading novices may suffer losses in the initial application.
Similarly, when encountering extremely strong or weak market conditions, KD is likely to stay above 80 or below 20. Therefore, in a one-sided market, the reference value of KD is relatively limited.
4 / MACD (Moving Average Convergence Divergence)
MACD has a long history, and its calculation formula is relatively complex. Let's first briefly introduce the parameters and practical applications. Generally speaking, the common parameters of MACD are (12.26.9). Since MACD has larger parameters, compared with the above RSI and KD indicators, MACD usually sends out buy and sell signals later. However, it also has relatively fewer false signals, making it suitable for medium and long-term transactions.

Definition and application of MACD
The MACD indicator consists of a bar (yellow), a zero axis and a DIF line (blue). When the bar turns from negative to positive (from below the zero axis to above the zero axis), the DIF line breaks through the zero axis from bottom to top, which represents an upward trend and is considered a buy signal. Conversely, when the bar turns from positive to negative (from above the zero axis to below the zero axis), the DIF line breaks through the zero axis from top to bottom, which is a sell signal.
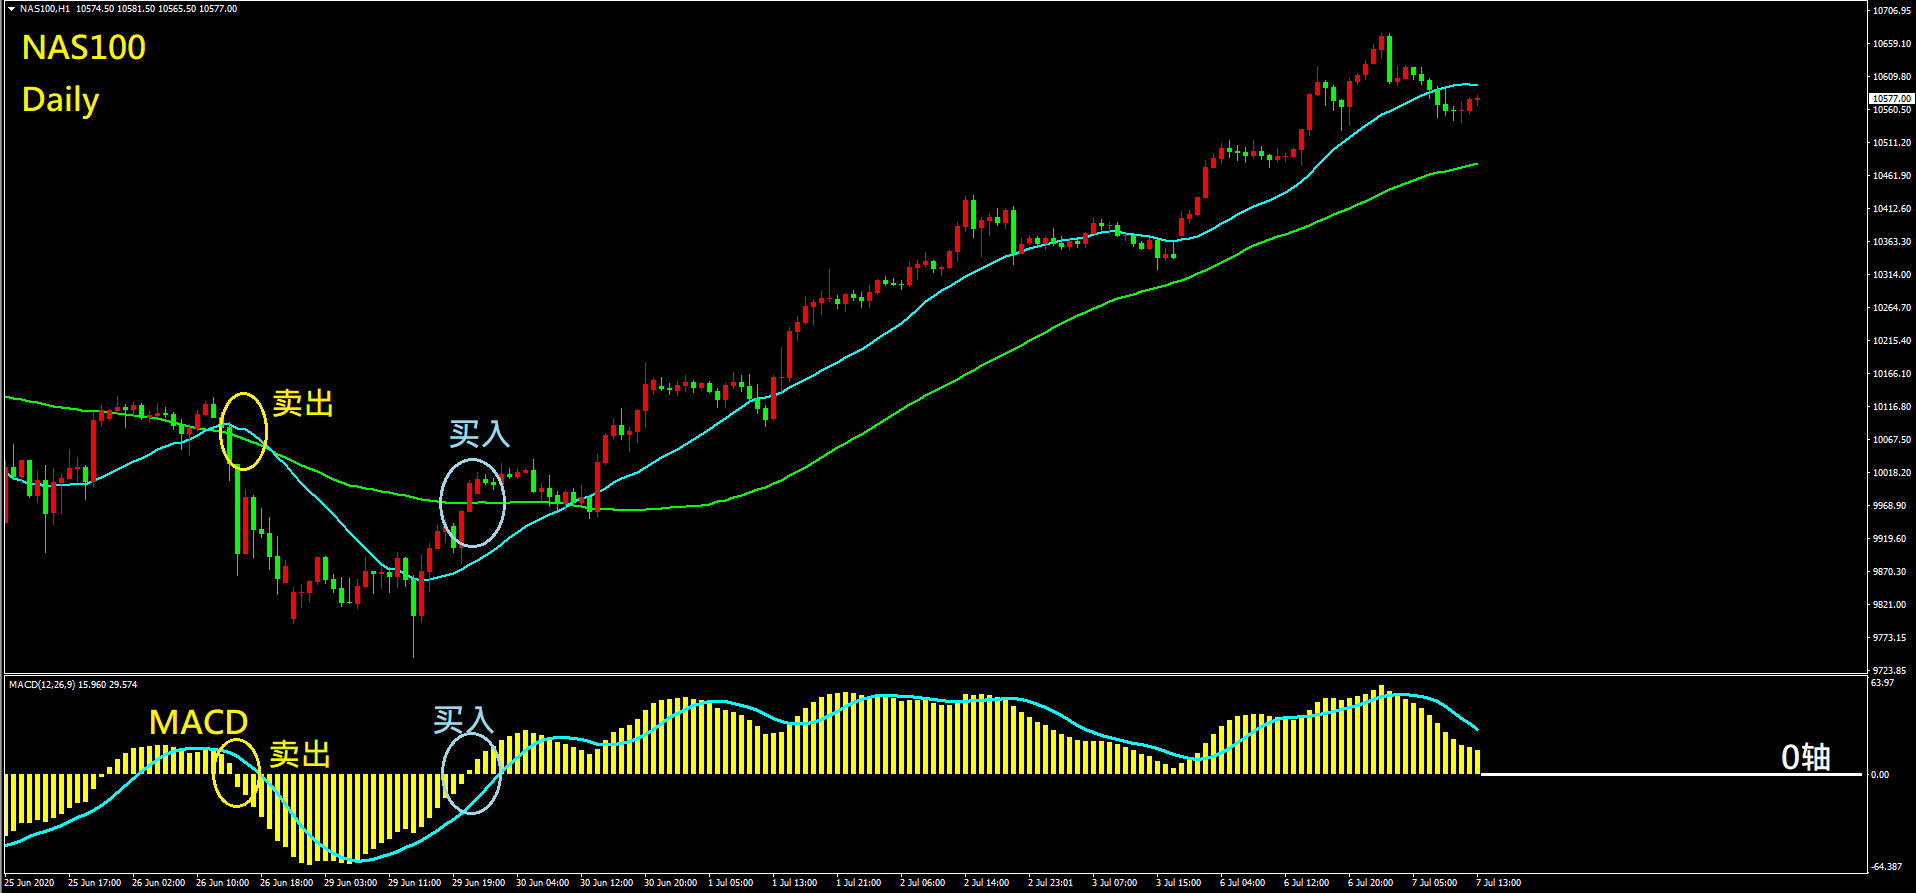
As shown in the above figure, the DIF line and the column break through the zero axis upward, which is a buy signal. If you enter the market and go long at this time, you are likely to buy at a relatively low point of the upward trend and earn a rich return.
Advantages of MACD
Judging trends by the relationship between the bar and the zero axis is more intuitive to use and has fewer false signals, so it is generally popular among novice foreign exchange traders.
Disadvantages of MACD
When the market fluctuates rapidly, MACD has a lag, so if it is used for short-term trading, it is easy to miss the buying and selling opportunities. In addition, MACD does not perform well for the shock/dollar line, which to some extent tests the consumer's ability to identify trends and trend patterns, and is not suitable for consumers who want to seize the opportunity.