In the investment market, some traders who believe in technical analysis often mention the golden cross and the death cross. This article will introduce how the two are formed, their structure and how to use them, to help you better understand these familiar chart trends and more easily determine trend changes.
What are the Golden Cross and Death Cross?
Before introducing the golden cross and death cross, we need to first understand how the moving average is constructed. The moving average, also known as the moving average, is a simple addition of the closing prices of each day to calculate the average, thereby obtaining a curve trajectory with a trend. Because it is calculated based on historical prices, the moving average has a certain lag for the current price, but because of its characteristic of learning from history, the moving average is better than other technical analysis in interpreting trends. In addition, the moving average has the effect of promoting rises and falls. Once the market forms a trend, the moving average will also maintain the extension direction for a period of time.
Using the moving average can show the trend of average price changes and reduce the interference caused by daily price fluctuations. With different moving average parameter time settings, the moving trajectory is also different. At this time, the characteristics of the crossover of long-term and short-term moving averages are used to determine the timing of entry, which is called "golden cross" or "death cross".
1 / Moving Average Crossover
Moving Average Golden Cross
"Golden Cross" refers to when the decline of the longer-term moving average gradually slows down, and the shorter-term moving average breaks through the longer-term moving average from bottom to top, indicating that the downward trend in prices may have stopped, and consolidation or a new wave of upward trend may occur.
At this time, the arrangement order should be: price>short-term moving average>long-term moving average. When the short-term moving average is above the long-term moving average, it is called "moving average bullish arrangement". At this time, the moving average will have a supporting effect, and the support strength of the long-term moving average will be greater than the short-term support strength.
Generally speaking, the appearance of a "golden cross" is a bullish signal. At this time, you should think from a bullish perspective and look for opportunities to enter long positions at low levels. If you hold long positions, you can choose to continue holding; on the contrary, if you hold short positions, you should choose to close your positions at a low point after the price encounters resistance and then falls back.
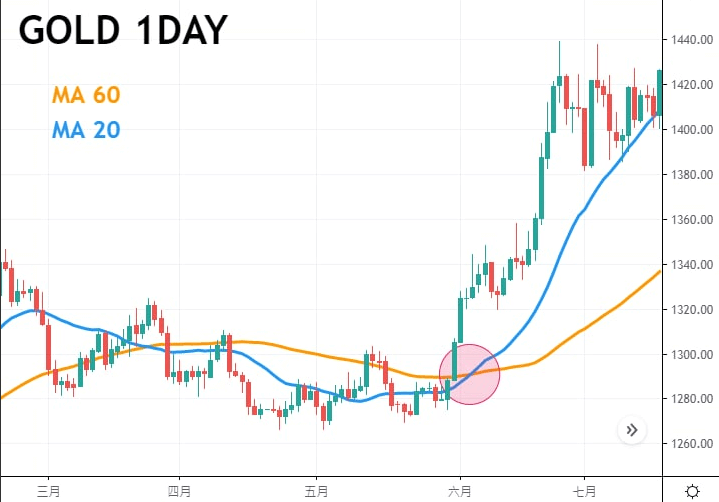
Figure 1: Example of a golden crossover of moving averages
Moving Average Death Cross
"Death cross" means that when the longer-term moving average gradually slows down its rise, and the shorter-term moving average breaks through the longer-term moving average from top to bottom, it means that the price rise trend may have stopped, and consolidation or a new wave of downward trend may occur.
At this time, the arrangement order should be: price < short-term average line < long-term average line. When the short-term average line is below the long-term average line, it is called "short moving average arrangement". At this time, the moving average will have a suppressive effect, and the suppressive force of the long-term moving average will be greater than that of the short-term.
Generally speaking, the appearance of a "death cross" is a short signal. At this time, you should think from the short side and look for opportunities to enter short orders at high levels. If you hold a short order, you can choose to continue holding it; if you hold a long order, you should consider closing the position at a high point when the price rebounds from the bottom.
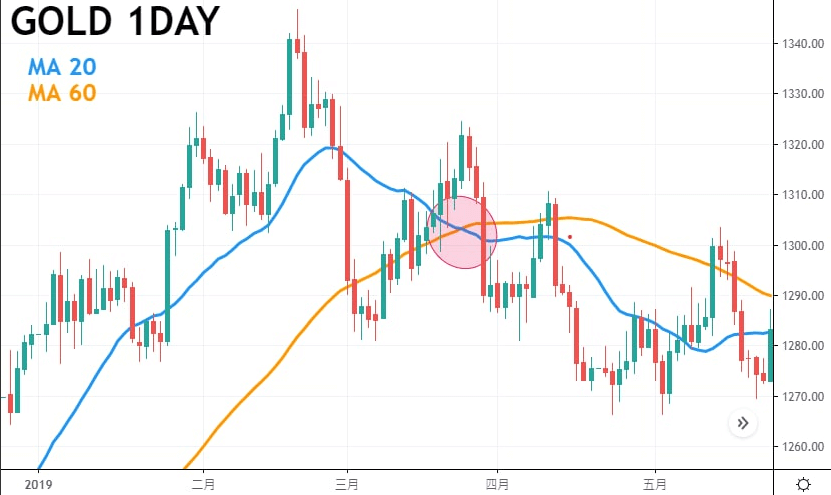
Figure 2: Moving average death cross example
Although the above moving average crossover sounds quite intuitive, in fact, the short-term and long-term moving average crossover consists of three stages:
1. First, before the price crosses the moving average, there is an upward (downward) trend. At this time, the price will first break through the short-term and long-term moving averages.
2. Then in this upward (downward) trend, the short-term moving average will follow the price from bottom to top (from top to bottom) and break through the long-term moving average. This is the second stage.
3. After the crossover, a new upward (downward) trend may emerge, and the short-term moving average will replace the long-term moving average and be located below (above) the price. At this time, if the trend continues, the short-term moving average will become a force to support (suppress) the price.
2 / KD Line Crossover
KD line is also called KD indicator or stochastic indicator, and its English name is "Stochastic Oscillator". It has been widely used in the foreign exchange market. KD indicator is mainly used to show the strength and weakness trend of the price in the past period. The calculation method requires first calculating the K value (called the fast line) and the D value (called the slow line). Traders then use the golden cross and death cross positions of the KD line as the entry and exit signals.
KD线黃金交叉
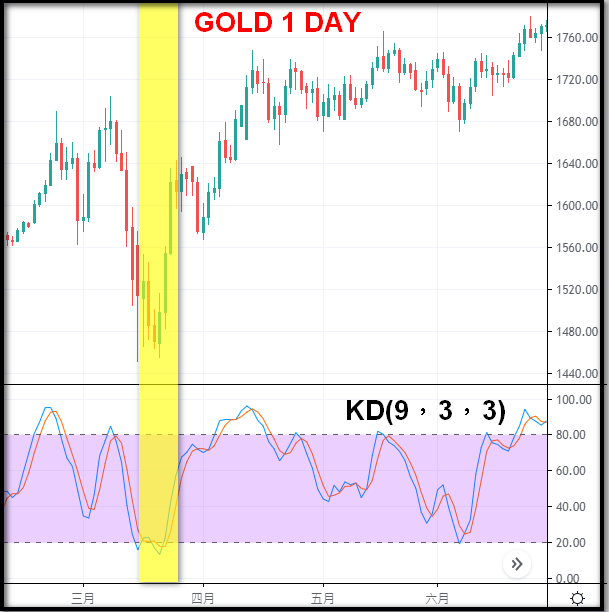
Chart 3: KD line golden cross example
As shown in the yellow area of Figure 3, when the K value (fast line) crosses the D value (slow line) from bottom to top at a low level (below 20), it is called a "golden cross". At this time, the price rebounds from the low point of the band and starts an upward trend until it falls back after the death cross occurs.
KD line death cross

Figure 4: KD line death cross example
As shown in the yellow area of Figure 4, when the K value (fast line) crosses the D value (slow line) from top to bottom at a high level (above 80), it is called a "death cross". At this time, the price falls back from the high point of the band, starting a downward trend, and it will not stabilize until the golden cross occurs.
3 / MACD Crossover
MACD 黃金交叉
MACD consists of a column and two fast and slow lines. The column represents the difference between the two lines. There is a dividing line in the middle with a value of 0. A column above 0 represents a bullish pattern, and below 0 represents a bearish pattern. When the fast line crosses the slow line from bottom to top, it represents a golden cross (there is a probability that the price will rise in the short term), and when the fast line crosses the slow line from top to bottom, it represents a dead cross (there is a probability that the price will fall in the short term).
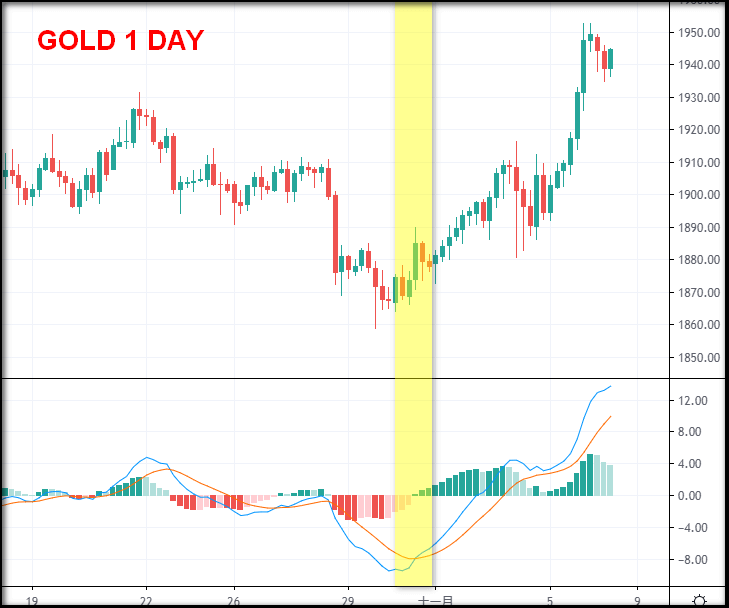
Figure 5: MCAD Golden Cross Example
As shown in the yellow area of Figure 5, when the fast line and the slow line both form a golden cross below the 0 axis, the price also starts an upward trend from a low level. When the column turns from bottom to top, the same bullish effect as the bullish arrangement of the moving average also appears.
MACD Death Cross
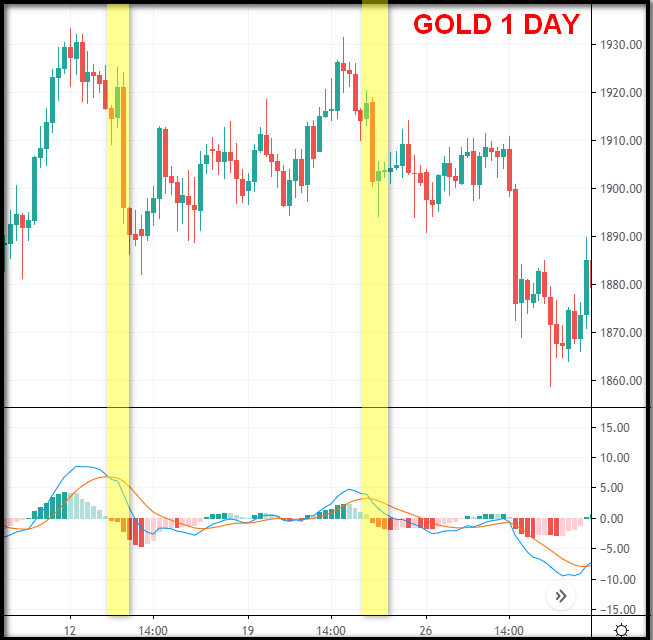
Figure 6: MCAD Death Cross Example
As shown in the yellow area of Figure 6, when the fast line and the slow line both form a death cross above the 0 axis, the price also starts a downward trend from a high level. When the column turns from top to bottom, the same falling effect as the short-selling arrangement of the moving average also appears. The price does not stabilize until a golden cross occurs.
黃金交叉的局限与注意事項
The market will not continue to go straight up or down, nor will there be only two trends, long and short. In a long market, there will inevitably be a decline, and in a short market, there will inevitably be a rebound. If you strictly follow the rules of moving average crossover when the long and short positions are unclear, the trend is unclear, and the price fluctuates violently, you will suffer huge losses. At this time, there is another question. If you wait until the trend is clear and the moving average crosses before entering the market, the price has basically left the bottom or the top. Does this entry point violate the trading taboo of chasing ups and downs? This is because the moving average has a big fatal flaw, which is its lag problem.
When the original trend of commodity prices is reversed, the moving average has the characteristic of tracking the trend, but due to its calculation model, the speed of its turning cannot keep up with the rapidity of the price. If you wait until the moving average crosses before exiting according to discipline, your wallet may have suffered heavy losses.
On the other hand, the larger the moving average parameter value is, the longer the statistical time is. Due to its calculation model, the stability of the long-term moving average will be more obvious than the short-term moving average. It also means that the long-term moving average has a lower turning frequency, which can filter out many misjudgments and noises. It will not start to extend in the trend direction until the price trend becomes clearer. At this time, if traders wait until the moving average crosses before entering the market, although the safety factor is higher, the profit range may be narrowed due to the fatal injury of lag.
Investors need to be aware that if they only rely on the golden cross or death cross as the basis for entry and exit, they will fall into many trading blind spots, because the moving average is only a basic trend line. It is recommended to use other technical analysis tools in combination to make up for its lag problem so that it can play its role in helping to boost or depress prices.