In the scope of technical analysis, pattern development is an important part. If you can correctly and appropriately identify various pattern trends, it will be very beneficial for trading. The wedge pattern is a common trend. If you master its characteristics, you can deploy strategies faster and more accurately.
The wedge pattern is a pattern that occurs when prices are consolidated and fluctuate in a narrow range within the chart. The fluctuation range needs to be weaker than the previous wave. Finally, the price breaks through the trend line and chooses a direction. The following 3 principles should be followed to draw a wedge
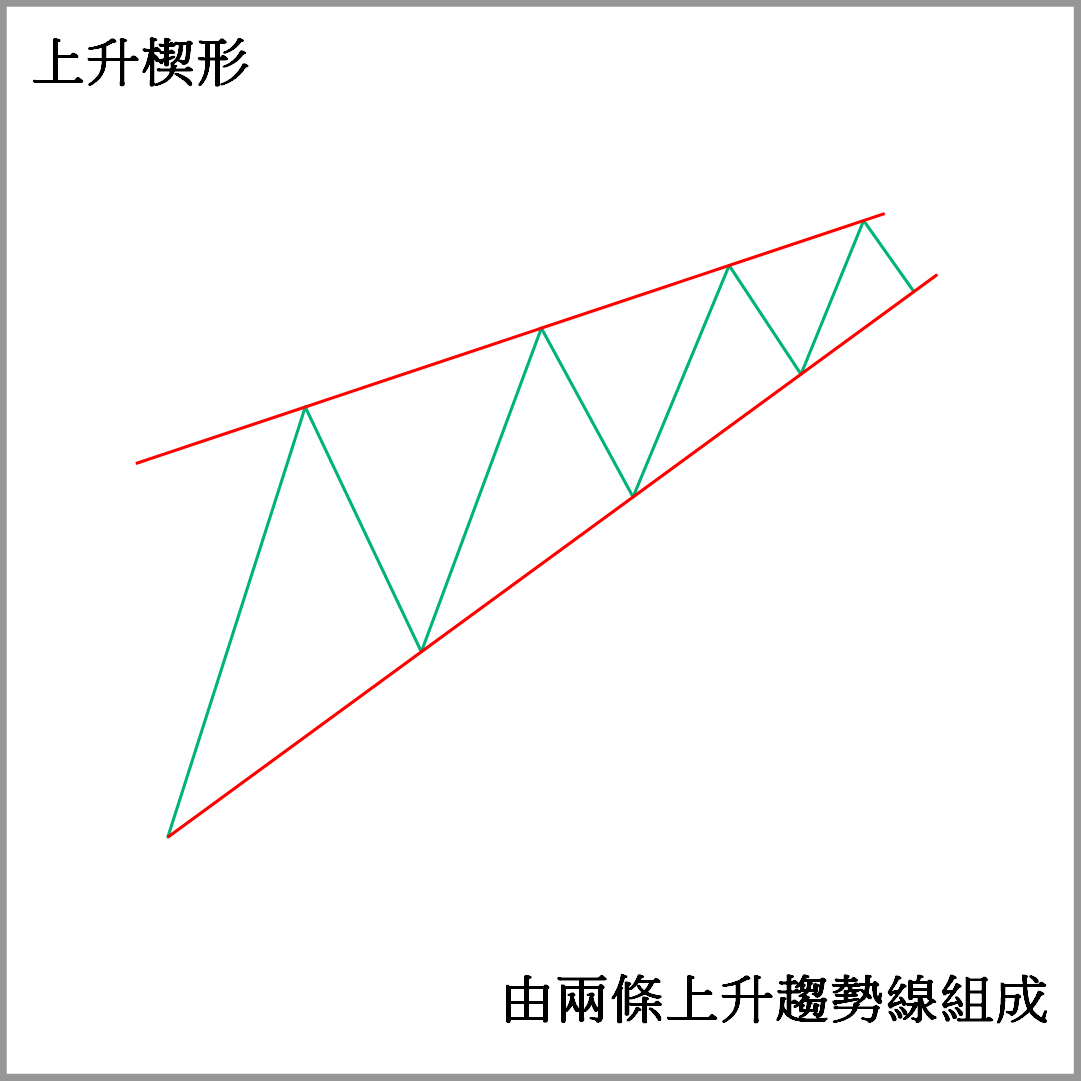
1. Two trend lines connecting the peaks and troughs
2. In the same direction and converging, not parallel to each other
3. There needs to be an obvious (and likely to appear) intersection not far away in the line graph
What is a rising wedge?
The rising wedge is one of the two wedge patterns. The rising wedge is formed by two intersecting rising trend lines. It can be seen as an extension of the trend or a reversal of the trend, depending on the trend in which the pattern appears, but the subsequent trend is mainly bearish.
If a rising wedge appears in a rebound wave of a bearish trend, it means that the decline may continue. Since the bullish momentum cannot effectively break through the trend line formed by the upper peaks, the price rise may just be a profit-taking by the bears or a life-saving wave by the bulls. Therefore, there is a greater probability that the price will fall below the trend line formed by the lower trough. At this time, the bears will dominate the price trend again.
If a rising wedge appears in a bullish trend, it means that the rally may be coming to an end, because the two trend lines are gradually narrowing and the high and low points of the prices are getting closer and closer, which means that the bullish momentum is getting weaker and there is a high probability that a top will be formed, causing the bullish trend to be reversed and a downward trend to start.
Rising wedge trading strategy
No matter the rising wedge appears at the top of an upward trend or in the middle of a downward trend, it usually means that the bears will dominate the market. The price fluctuations in the wedge are regarded as the last struggle of the bulls after being suppressed by the momentum of the bears. It also represents a signal that the price has reached its peak or will continue to fall, and the subsequent trend will most likely be a downward trend.
The following will introduce the entry and exit of the wedge trading pattern with icons.
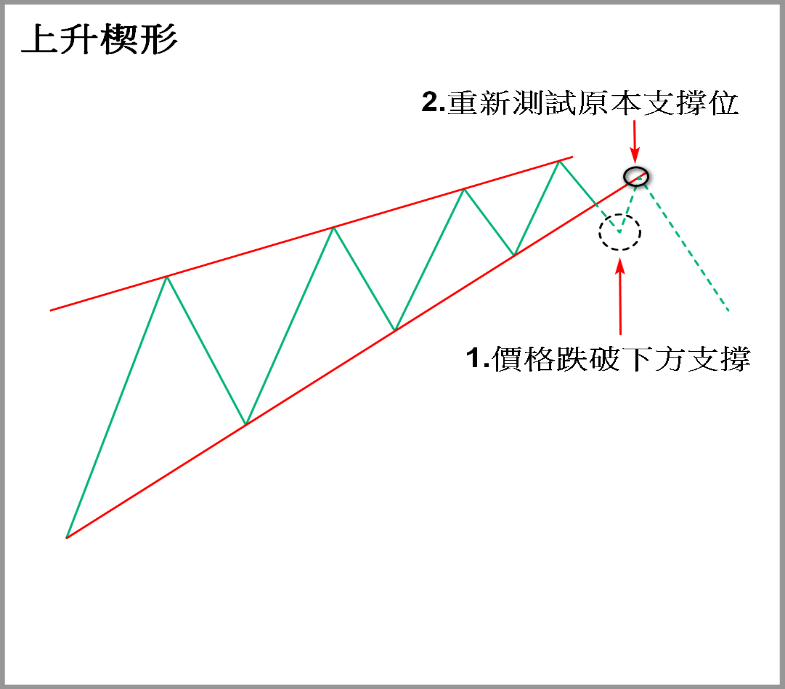
After the rising wedge is established, it is necessary to wait for the price to fall below the lower support level (lower trend line), which means that the pattern has been destroyed. Then when the price retests the original support level (the original support level turns into a pressure level), enter the market to intervene in the short order.
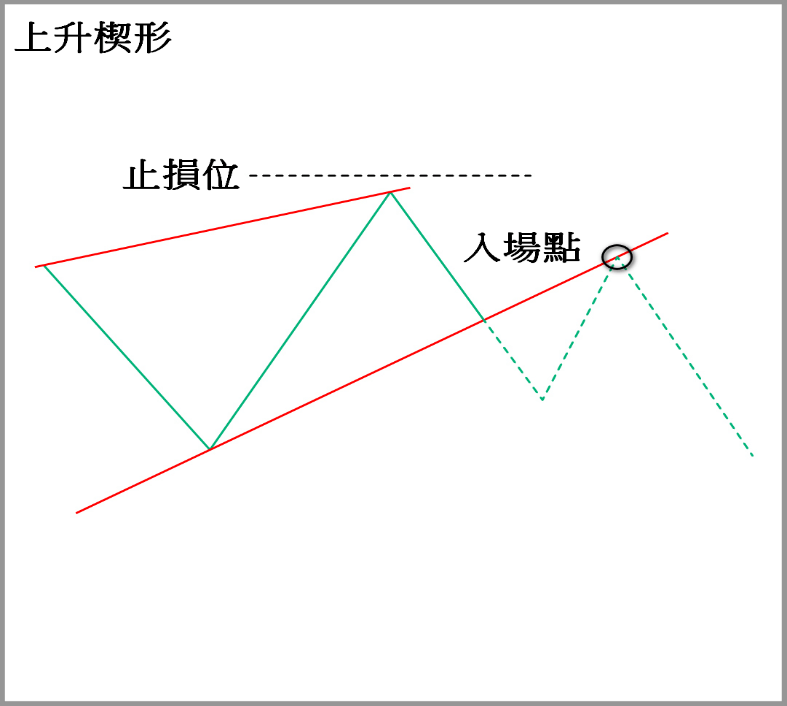
After entering the market, the stop loss can be placed above the previous high. If the price reaches above the previous high, it means a new high and the market may have a new trend. Therefore, those holding short positions should stop loss as soon as possible.
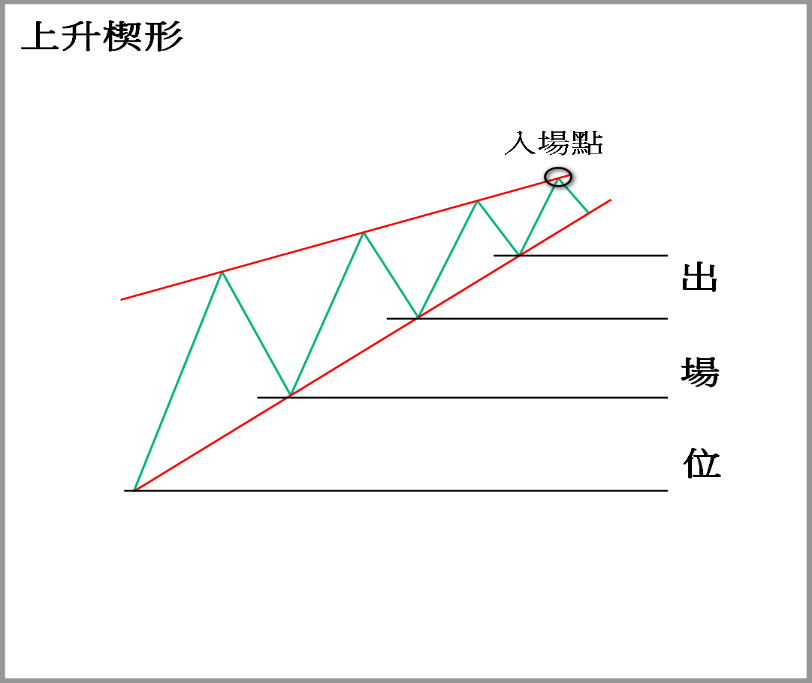
The low point of each consolidation can be used as a potential support level, and these support levels can be used as a basis for exiting the market.
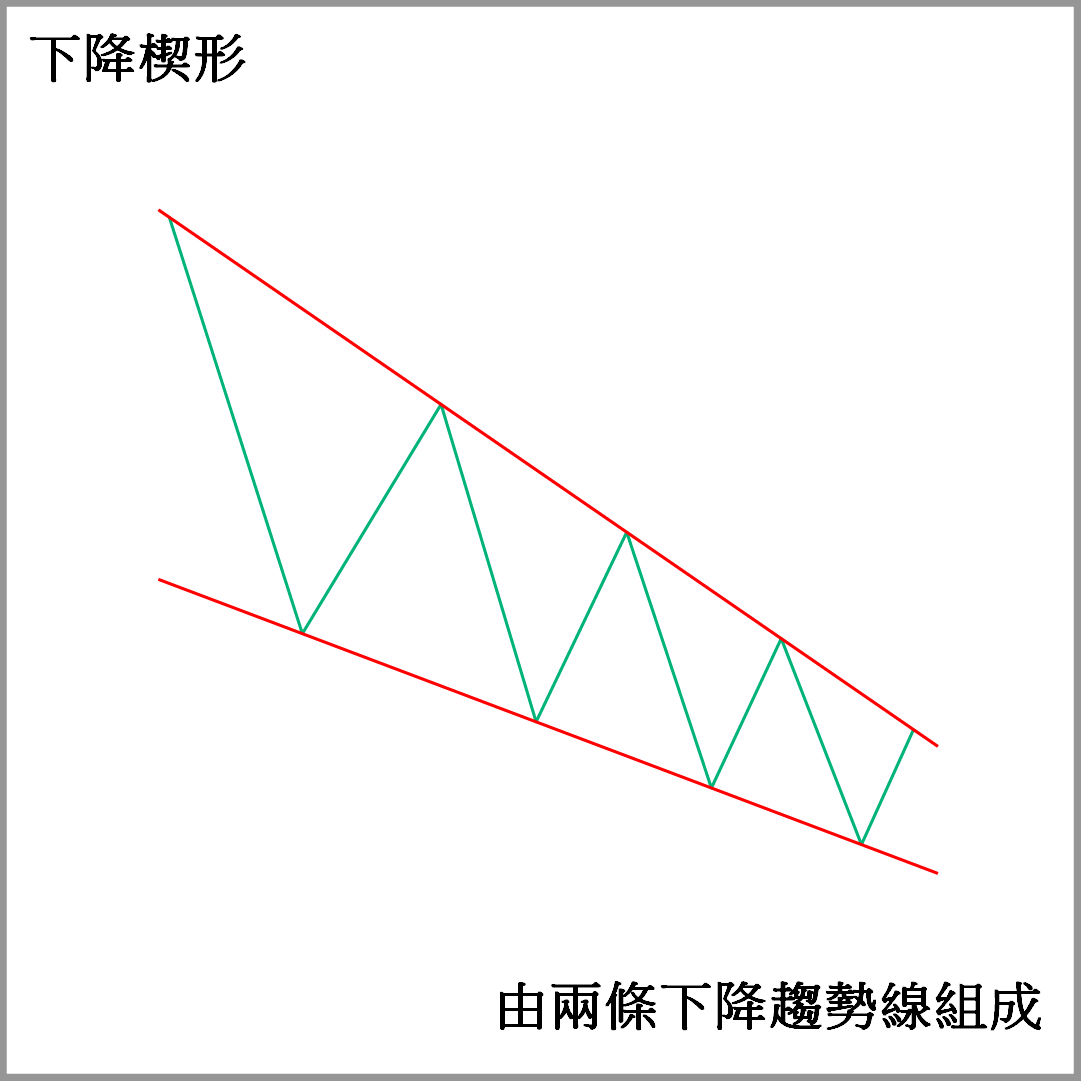
What is a falling wedge?
The full name of the falling wedge is "Falling Wedge", which is one of the two wedge patterns. The falling wedge is formed by two intersecting downward trend lines. It can be regarded as an extension of the trend or a reversal of the trend, depending on the trend in which the pattern appears, but the subsequent trend is mainly bullish.
If a descending wedge appears in a pullback wave of a bullish trend, it means that the upward trend may continue. Since the bearish momentum cannot effectively break through the trend line formed by the peaks and valleys below, the price drop may just be a profit-taking by the bulls or a life-saving wave by the bears. Therefore, there is a greater probability that the price will break through the trend line formed by the upper peaks. At this time, the bulls will dominate the price trend again.
If a descending wedge appears in a bearish trend, it means that the decline may be coming to an end, because the two trend lines begin to narrow and the high and low points between the prices are getting closer and closer, which means that the bearish momentum is getting weaker and weaker. There is a high probability that a bottom will be formed, causing the bearish trend to be reversed and an upward trend to start.
Falling Wedge Trading Strategies
Whether the falling wedge appears at the bottom of a downward trend or in the middle of an upward trend, it usually means that the bulls will dominate the market. The price fluctuations in the wedge are regarded as the last struggle of the bears after the kinetic energy is suppressed by the bulls. It also represents that the price has bottomed out or will continue to rise. The subsequent trend is likely to be an upward trend. Whether the falling wedge appears at the bottom of a downward trend or in the middle of an upward trend, it usually means that the bulls will dominate the market. The price fluctuations in the wedge are regarded as the last struggle of the bears after the kinetic energy is suppressed by the bulls. It also represents that the price has bottomed out or will continue to rise. The subsequent trend is likely to be an upward trend.
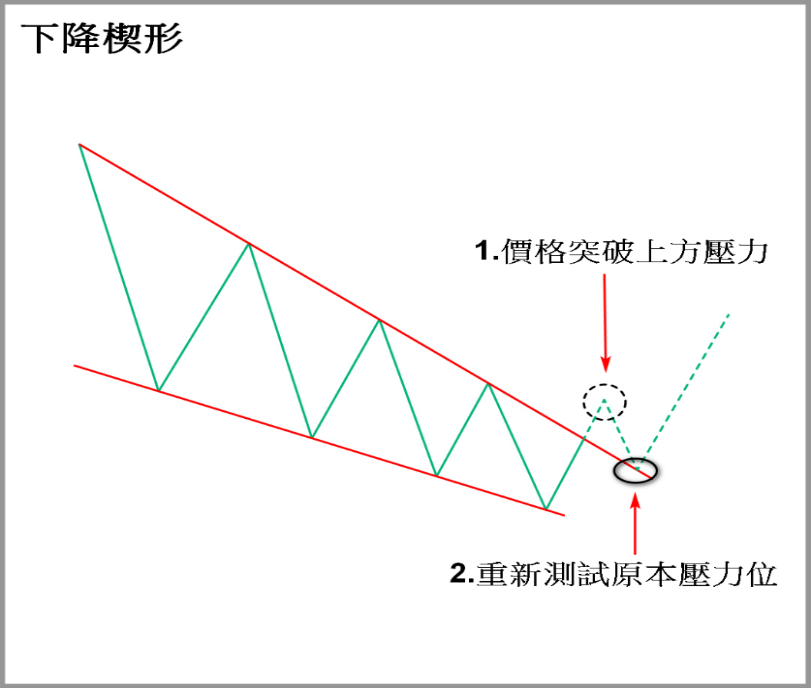
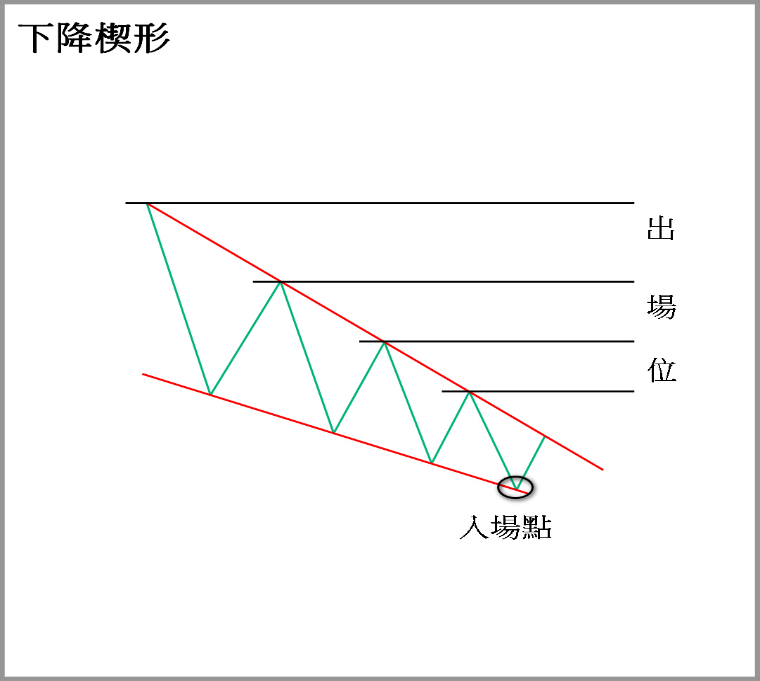
After the descending wedge is established, it is necessary to wait for the price to break through the upper pressure level (upper trend line), which means that the pattern has been destroyed, and then enter the market to intervene in long orders when the price retests the original pressure level (the original pressure level turns into support level).
After entering the market, the stop loss can be placed below the previous low. If the price reaches below the previous low, it means a new low and the market may have a new trend. Therefore, those holding long positions should stop loss and exit the market.
The high point of each consolidation can be used as a potential pressure point, and these pressure points can be used as a basis for exiting the market.
in conclusion
When a wedge pattern appears on the market, investors should pay close attention. Like the triangle pattern, it means that the market has been settled and sorted for a period of time, the potential trend is being suppressed, and a new market may break out at any time. Generally speaking, the larger the cycle level of the wedge, the stronger the trend after the outbreak.
On the other hand, investors need to be reminded that the financial market is changing rapidly, and the market conditions have different backgrounds. Although the wedge pattern has been verified by history and has a high probability of developing in the direction described in the article, if the price happens to break in the opposite direction, it will likely evolve into a one-way channel. At this time, the price may run in a new one-way channel and start a new trend.